
Note
Go to the end to download the full example code or to run this example in your browser via JupyterLite.
Tavella-Randall non-uniform grids#
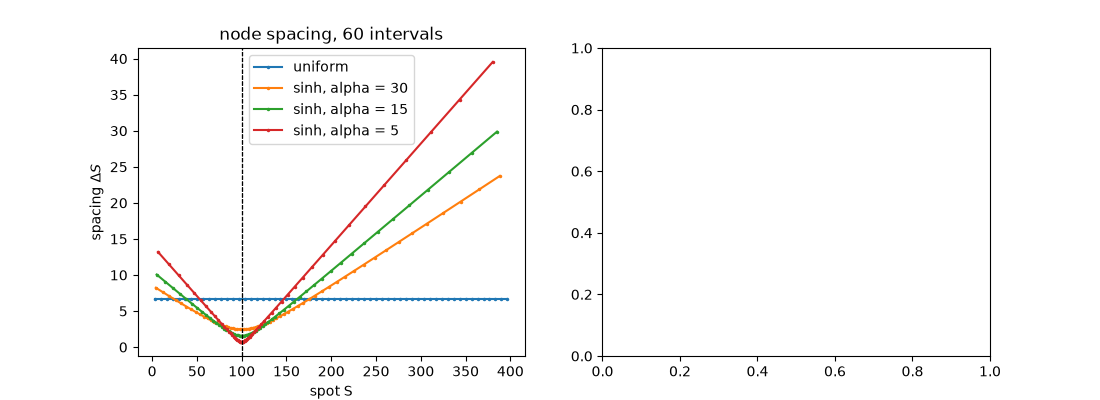
Away from the strike a vanilla option is almost linear, so a uniform
grid spends most of its nodes where nothing happens. Tavella and Randall
(2000) map a uniform coordinate through a hyperbolic sine to cluster the
nodes around the strike, keeping the grid smooth so the three-point
differences stay second order.
tavella_randall_grid() builds the grid, and
grid="tavella_randall" prices on it: the same accuracy with a fraction
of the nodes.
import matplotlib.pyplot as plt
import numpy as np

from financialkit.options import black_scholes_price
from financialkit.pde_methods import CrankNicolson, tavella_randall_grid, uniform_grid
from financialkit.pde_methods.visualizers import plot_grid

S, K, T, r, sigma = 100.0, 100.0, 0.5, 0.05, 0.2
exact = black_scholes_price(S, K, T, r, sigma)

fig, axes = plt.subplots(1, 2, figsize=(11, 4))
plot_grid(uniform_grid(0.0, 400.0, 60), ax=axes[0], label="uniform")
for alpha in (30.0, 15.0, 5.0):
    plot_grid(tavella_randall_grid(0.0, 400.0, 60, K, alpha), ax=axes[0], K=K, label=f"sinh, alpha = {alpha:g}")
axes[0].set_title("node spacing, 60 intervals")
Text(0.5, 1.0, 'node spacing, 60 intervals')
Error against the number of spot intervals#
ms = np.array([20, 40, 80, 160])
for grid, kw in (("uniform", {}), ("tavella_randall", {"concentration": 0.15})):
    err = [abs(CrankNicolson(m, 400, rannacher_steps=2, s_max=400.0, grid=grid, **kw).price(S, K, T, r, sigma).price - exact) for m in ms]
    axes[1].loglog(ms, err, "o-", label=grid)
axes[1].set_xlabel("spot intervals M")
axes[1].set_ylabel("absolute error")
axes[1].legend()
fig.tight_layout()
plt.show()
Total running time of the script: (0 minutes 0.142 seconds)
