
Note
Go to the end to download the full example code or to run this example in your browser via JupyterLite.
Peaceman-Rachford ADI#
With two assets every implicit step couples a whole plane of unknowns.
Donald Peaceman and Henry Rachford (1955), modelling oil reservoirs,
split each step into two half steps, each implicit in one direction
only, so that a step is a set of independent tridiagonal solves.
PeacemanRachfordADI prices Margrabe’s
option to exchange one asset for another, whose exact value is
Black-Scholes with the second asset as the strike and the volatility of
the ratio, \(\sqrt{\sigma_1^2 + \sigma_2^2 - 2\rho\sigma_1\sigma_2}\).
import matplotlib.pyplot as plt
import numpy as np

from financialkit.options import black_scholes_price
from financialkit.pde_methods import PeacemanRachfordADI
from financialkit.pde_methods.visualizers import plot_adi_surface

S1, S2, T, r, sigma1, sigma2 = 100.0, 95.0, 1.0, 0.05, 0.2, 0.3


def exchange(s1, s2):
    return np.maximum(s1 - s2, 0.0)


def margrabe(rho):
    return black_scholes_price(S1, S2, T, 0.0, np.sqrt(sigma1**2 + sigma2**2 - 2 * rho * sigma1 * sigma2))


res = PeacemanRachfordADI(120, 120, 60).price(S1, S2, T, r, sigma1, sigma2, 0.5, exchange)
print(f"ADI {res.price:.4f}, Margrabe {margrabe(0.5):.4f}")
ADI 12.9478, Margrabe 12.9523
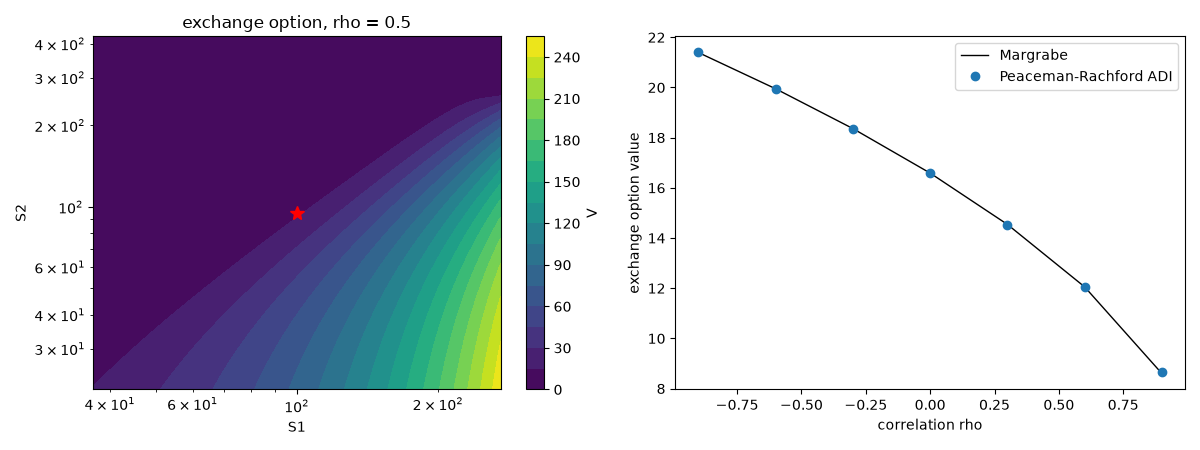
The value surface, and the price across correlations#
fig, axes = plt.subplots(1, 2, figsize=(12, 4.5))
plot_adi_surface(res, ax=axes[0], log=True)
axes[0].plot(S1, S2, "r*", ms=10)
axes[0].set_title("exchange option, rho = 0.5")

rhos = np.linspace(-0.9, 0.9, 7)
adi = [PeacemanRachfordADI(80, 80, 40).price(S1, S2, T, r, sigma1, sigma2, rho, exchange).price for rho in rhos]
axes[1].plot(rhos, [margrabe(rho) for rho in rhos], "k", lw=1, label="Margrabe")
axes[1].plot(rhos, adi, "o", label="Peaceman-Rachford ADI")
axes[1].set_xlabel("correlation rho")
axes[1].set_ylabel("exchange option value")
axes[1].legend()
fig.tight_layout()
plt.show()
Total running time of the script: (0 minutes 0.202 seconds)
