
Note
Go to the end to download the full example code or to run this example in your browser via JupyterLite.
Michaud’s resampled efficiency#
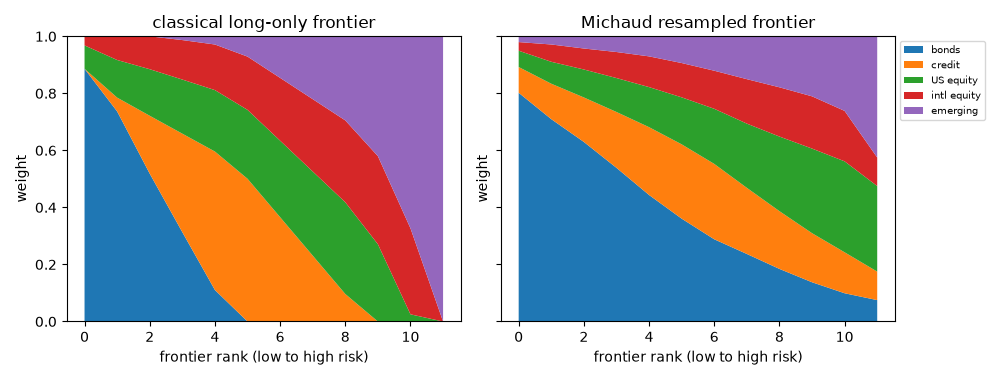
Richard Michaud (1998) called mean-variance optimizers “estimation-error maximizers”: they put the most weight on the assets whose expected returns were most overestimated. His remedy treats the estimates as one draw among many. Resample histories from them, compute each history’s frontier, and average the weights rank by rank along the frontier. The resampled portfolios are more diversified and change more gradually with risk than the classical corner solutions.
import matplotlib.pyplot as plt
import numpy as np

from financialkit.portfolio import resampled_frontier
from financialkit.portfolio.visualizers import plot_weights

names = ["bonds", "credit", "US equity", "intl equity", "emerging"]
mu = np.array([0.03, 0.045, 0.07, 0.075, 0.09])
vol = np.array([0.05, 0.08, 0.16, 0.18, 0.25])
corr = np.array(
    [
        [1.0, 0.6, -0.1, -0.1, 0.0],
        [0.6, 1.0, 0.3, 0.3, 0.4],
        [-0.1, 0.3, 1.0, 0.8, 0.7],
        [-0.1, 0.3, 0.8, 1.0, 0.75],
        [0.0, 0.4, 0.7, 0.75, 1.0],
    ]
)
cov = corr * np.outer(vol, vol)
Classical and resampled compositions#
40 resamples of ten years of annual-scale data, 12 ranks each.
res = resampled_frontier(mu, cov, n_obs=10, n_resamples=40, n_points=12, rng=0)
fig, (ax1, ax2) = plt.subplots(1, 2, figsize=(10, 3.8), sharey=True)
plot_weights(res.frontier.weights, x=np.arange(12), ax=ax1)
ax1.get_legend().remove()
ax1.set_title("classical long-only frontier")
plot_weights(res.weights, labels=names, x=np.arange(12), ax=ax2)
ax2.set_title("Michaud resampled frontier")
for ax in (ax1, ax2):
    ax.set_xlabel("frontier rank (low to high risk)")
fig.tight_layout()
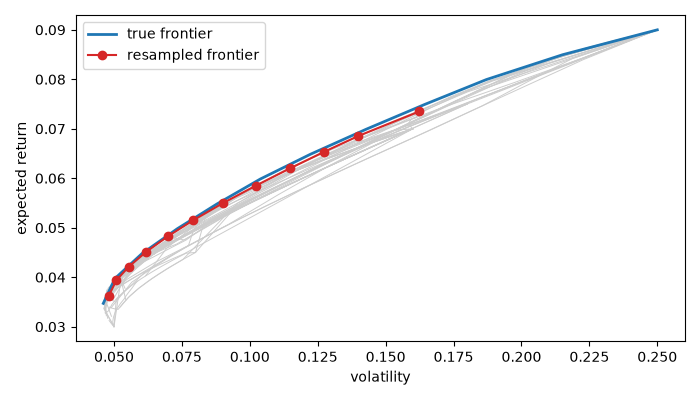
The resampled frontier lies inside the true one#
Under the true inputs the averaged portfolios are slightly inefficient, the price of robustness; each resample’s own frontier, evaluated at the truth, is far worse.
fig, ax = plt.subplots(figsize=(7, 4))
for s in range(res.sample_weights.shape[0]):
    W = res.sample_weights[s]
    ax.plot(np.sqrt(np.einsum("ij,jk,ik->i", W, cov, W)), W @ mu, color="0.8", lw=0.7)
ax.plot(res.frontier.volatilities, res.frontier.returns, lw=2, label="true frontier")
ax.plot(res.volatilities, res.returns, "o-", color="C3", label="resampled frontier")
ax.set_xlabel("volatility")
ax.set_ylabel("expected return")
ax.legend()
fig.tight_layout()
plt.show()
Total running time of the script: (0 minutes 0.201 seconds)
