
Note
Go to the end to download the full example code or to run this example in your browser via JupyterLite.
Young’s Calmar ratio and drawdowns#
A drawdown is the fall from the highest wealth reached so far. Terry Young (1991) proposed judging managed-futures funds by their compound annual return divided by their maximum drawdown, the Calmar ratio, because investors leave a fund after a deep drawdown long before its volatility looks alarming. Two strategies with the same mean and volatility can have very different drawdowns if their bad days cluster.
import matplotlib.pyplot as plt
import numpy as np

from financialkit.risk import calmar_ratio, drawdowns
from financialkit.risk.visualizers import plot_drawdowns

rng = np.random.default_rng(3)
n = 3 * 252
mu, sigma = 0.10 / 252, 0.15 / np.sqrt(252)
One path, dissected#
r = mu + sigma * rng.standard_normal(n)
res = drawdowns(r)
axes = plot_drawdowns(res)
axes[0].set_title(f"max drawdown {res.max_drawdown:.1%}, Calmar {calmar_ratio(r):.2f}")
print(f"peak at day {res.peak_index}, trough at day {res.trough_index}, recovered at day {res.recovery_index}")
print(f"longest time under water: {res.longest_duration} days")
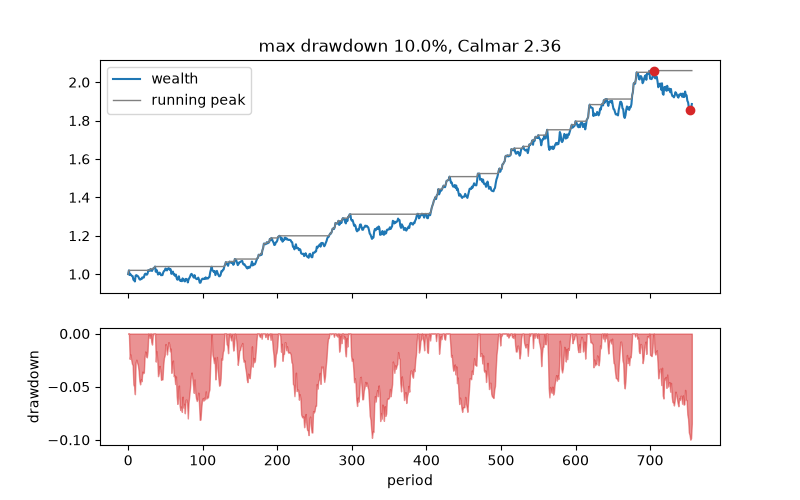
peak at day 705, trough at day 754, recovered at day -1
longest time under water: 92 days
Same moments, different order#
Sorting the middle year of the same daily returns so the worst come together leaves the mean and volatility unchanged but deepens the drawdown and cuts the Calmar ratio.
clustered = r.copy()
block = slice(n // 3, 2 * n // 3)
clustered[block] = np.sort(clustered[block])
for name, x in [("original order", r), ("clustered losses", clustered)]:
    d = drawdowns(x)
    print(f"{name:16s} mean {x.mean() * 252:.3f}, vol {x.std() * np.sqrt(252):.3f}, MDD {d.max_drawdown:.1%}, Calmar {calmar_ratio(x):.2f}")
original order   mean 0.223, vol 0.149, MDD 10.0%, Calmar 2.36
clustered losses mean 0.223, vol 0.149, MDD 57.4%, Calmar 0.41
The Calmar ratio across many paths#
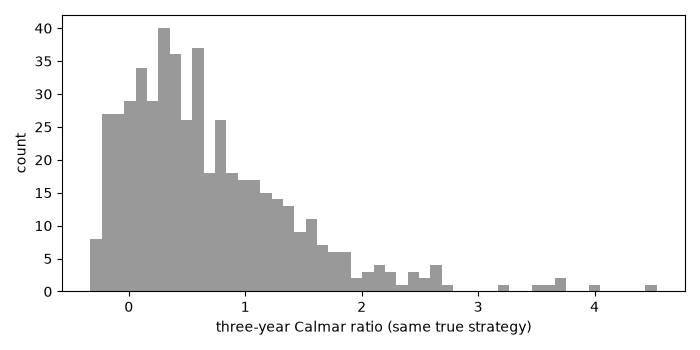
Over three years the maximum drawdown of a 15%-volatility strategy is itself very uncertain, so a single Calmar ratio says little.
calmars = np.array([calmar_ratio(mu + sigma * rng.standard_normal(n)) for _ in range(500)])
fig, ax = plt.subplots(figsize=(7, 3.5))
ax.hist(np.clip(calmars, -2, 6), bins=50, color="0.6")
ax.set_xlabel("three-year Calmar ratio (same true strategy)")
ax.set_ylabel("count")
fig.tight_layout()

plt.show()
Total running time of the script: (0 minutes 0.078 seconds)
