
Note
Go to the end to download the full example code or to run this example in your browser via JupyterLite.
O’Kane and Turnbull: the CDS par spread#
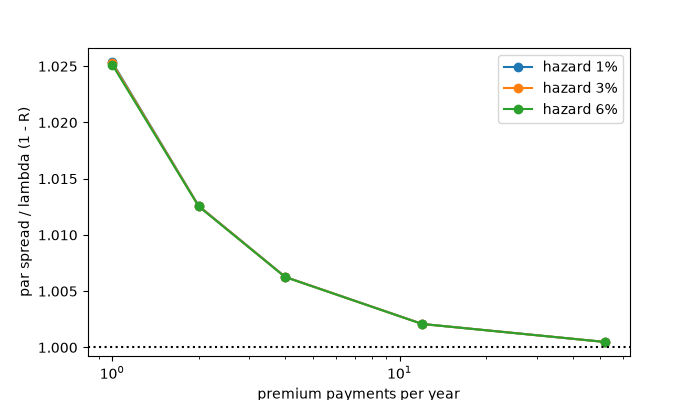
A credit default swap exchanges a running premium for a payment of \(1 - R\) at default. O’Kane and Turnbull (2003) wrote both legs as integrals over the default density and evaluated them on a grid with defaults at mid-step, including the premium accrued between the last payment date and default. The par spread equates the legs; for a flat hazard and a continuously paid premium it is exactly \(\lambda(1 - R)\).
import matplotlib.pyplot as plt
import numpy as np

from financialkit.credit import HazardCurve, cds_legs, cds_par_spread

res = cds_legs(HazardCurve.flat(0.02), 5.0, 0.05, 0.4, frequency=1, steps_per_year=1)
print("Hull's annual setting (hazard 2%, R = 40%, r = 5%):")
print(f"  premium annuity {res.rpv01 - res.accrued_on_default:.4f}, accrual {res.accrued_on_default:.4f}, protection {res.protection_leg:.4f}")
print(f"  par spread {1e4 * res.par_spread:.1f} bp  vs  credit triangle {1e4 * 0.02 * 0.6:.0f} bp")
Hull's annual setting (hazard 2%, R = 40%, r = 5%):
  premium annuity 4.0728, accrual 0.0422, protection 0.0506
  par spread 123.0 bp  vs  credit triangle 120 bp
Payment frequency and the credit triangle#
More frequent premiums and accrual on default converge to the triangle.
freqs = [1, 2, 4, 12, 52]
fig, ax = plt.subplots(figsize=(7, 4))
for h in (0.01, 0.03, 0.06):
    s = [cds_par_spread(HazardCurve.flat(h), 5.0, 0.05, 0.4, frequency=f, steps_per_year=max(f, 12)) for f in freqs]
    ax.semilogx(freqs, 1e4 * np.array(s) / (1e4 * h * 0.6), "o-", label=f"hazard {h:.0%}")
ax.axhline(1.0, color="k", ls=":")
ax.set_xlabel("premium payments per year")
ax.set_ylabel("par spread / lambda (1 - R)")
ax.legend()
<matplotlib.legend.Legend object at 0x11612ba10>
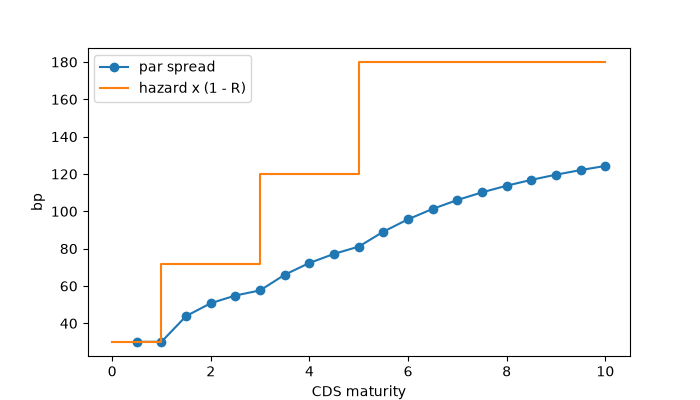
The term structure of par spreads#
curve = HazardCurve([1, 3, 5, 10], [0.005, 0.012, 0.02, 0.03])
mats = np.linspace(0.5, 10, 20)
fig, ax = plt.subplots(figsize=(7, 4))
ax.plot(mats, [1e4 * cds_par_spread(curve, T, 0.03) for T in mats], "o-", label="par spread")
ax.step([0, 1, 3, 5, 10], 1e4 * 0.6 * np.r_[0.005, curve.hazards], where="pre", label="hazard x (1 - R)")
ax.set_xlabel("CDS maturity")
ax.set_ylabel("bp")
ax.legend()

plt.show()
Total running time of the script: (0 minutes 0.648 seconds)
