
Note
Go to the end to download the full example code or to run this example in your browser via JupyterLite.
The ISDA standard model: bootstrapping hazard rates#
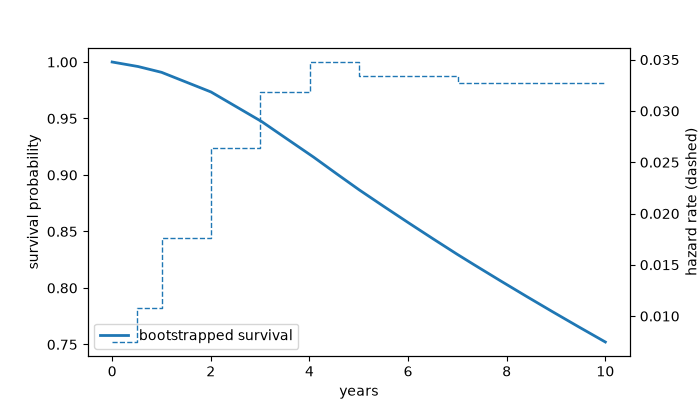
Since the 2009 “Big Bang” CDS trade with a fixed coupon (100 or 500 bp) and an upfront payment, and the ISDA standard model converts between quotes by bootstrapping a piecewise-constant hazard curve: solve for the hazard on \((0, T_1]\) that reprices the shortest CDS, freeze it, solve the next segment, and so on. The bootstrapped curve reprices every quote and gives survival probabilities at any date.
import matplotlib.pyplot as plt
import numpy as np

from financialkit.credit import bootstrap_hazard_curve, cds_par_spread, cds_upfront, upfront_to_spread
from financialkit.credit.visualizers import plot_survival

maturities = np.array([0.5, 1, 2, 3, 4, 5, 7, 10])
spreads = np.array([45, 55, 80, 105, 125, 140, 155, 165]) * 1e-4
r, R = 0.03, 0.4

curve = bootstrap_hazard_curve(maturities, spreads, r, R)
for T, s, h in zip(maturities, spreads, curve.hazards, strict=True):
    print(f"{T:4.1f}y  quote {1e4 * s:5.0f} bp  hazard {h:.4%}  reprices to {1e4 * cds_par_spread(curve, T, r, R):7.2f} bp")
 0.5y  quote    45 bp  hazard 0.7472%  reprices to   45.00 bp
 1.0y  quote    55 bp  hazard 1.0826%  reprices to   55.00 bp
 2.0y  quote    80 bp  hazard 1.7620%  reprices to   80.00 bp
 3.0y  quote   105 bp  hazard 2.6375%  reprices to  105.00 bp
 4.0y  quote   125 bp  hazard 3.1866%  reprices to  125.00 bp
 5.0y  quote   140 bp  hazard 3.4777%  reprices to  140.00 bp
 7.0y  quote   155 bp  hazard 3.3449%  reprices to  155.00 bp
10.0y  quote   165 bp  hazard 3.2701%  reprices to  165.00 bp
The curve#
<matplotlib.legend.Legend object at 0x116492a50>
Upfronts at the standard coupons#
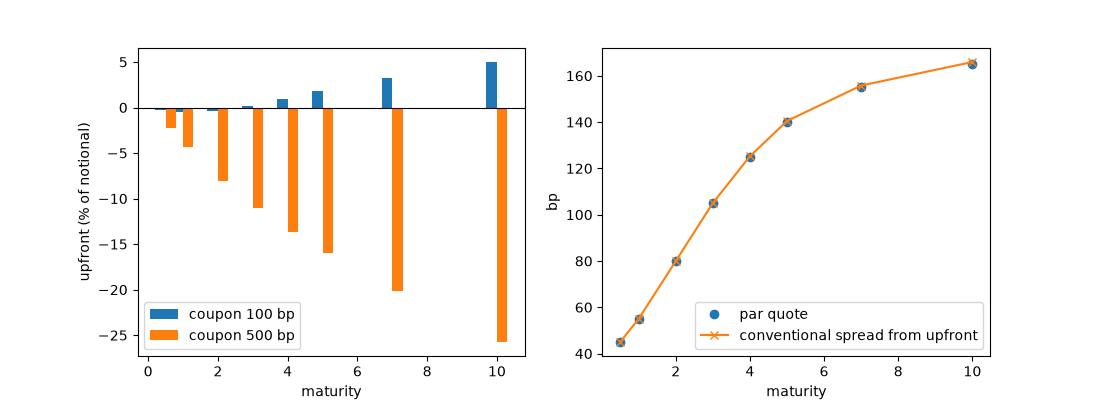
With a 100 bp coupon the buyer pays upfront when the par spread is higher and receives it when lower; the conversion back to a flat-hazard “conventional” spread recovers roughly the quote.
up100 = [cds_upfront(curve, T, 0.01, r, R) for T in maturities]
up500 = [cds_upfront(curve, T, 0.05, r, R) for T in maturities]
conv = [upfront_to_spread(u, 0.01, T, r, R) for u, T in zip(up100, maturities, strict=True)]
fig, ax = plt.subplots(1, 2, figsize=(11, 4))
ax[0].bar(maturities - 0.15, 100 * np.array(up100), 0.3, label="coupon 100 bp")
ax[0].bar(maturities + 0.15, 100 * np.array(up500), 0.3, label="coupon 500 bp")
ax[0].axhline(0, color="k", lw=0.8)
ax[0].set_xlabel("maturity")
ax[0].set_ylabel("upfront (% of notional)")
ax[0].legend()
ax[1].plot(maturities, 1e4 * spreads, "o", label="par quote")
ax[1].plot(maturities, 1e4 * np.array(conv), "x-", label="conventional spread from upfront")
ax[1].set_xlabel("maturity")
ax[1].set_ylabel("bp")
ax[1].legend()

plt.show()
Total running time of the script: (0 minutes 0.107 seconds)
