
Note
Go to the end to download the full example code or to run this example in your browser via JupyterLite.
Reiner-Rubinstein barrier options#
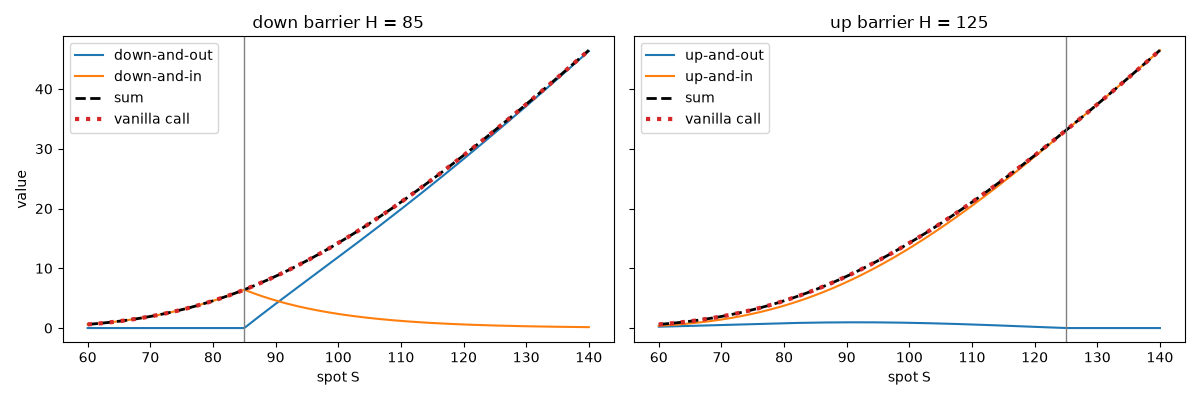
Eric Reiner and Mark Rubinstein (1991) wrote down closed forms for all eight single-barrier options – calls and puts, down and up, in and out – each with a cash rebate. Every one is a sum of six building blocks \(A, \dots, F\): the vanilla option, the vanilla struck at the barrier, their reflections through the barrier and the two rebates. Without rebates, a knock-in and a knock-out with the same terms add up to the vanilla option.
import matplotlib.pyplot as plt
import numpy as np

from financialkit.exotic_options import barrier_price
from financialkit.options import black_scholes_price
Haug’s table#
Haug (2007), Table 4-13: S = 100, T = 0.5, r = 8%, b = 4%, sigma = 25%, a rebate of 3, H = 95 for down barriers and 105 for up barriers.
K = np.array([90.0, 100.0, 110.0])
for option_type in ("call", "put"):
    for barrier_type, H in (("down-and-out", 95.0), ("down-and-in", 95.0), ("up-and-out", 105.0), ("up-and-in", 105.0)):
        v = barrier_price(100.0, K, H, 0.5, 0.08, 0.25, q=0.04, option_type=option_type, barrier_type=barrier_type, rebate=3.0)
        print(f"{barrier_type:>12} {option_type}: " + "  ".join(f"{x:8.4f}" for x in v))
down-and-out call:   9.0246    6.7924    4.8759
 down-and-in call:   7.7627    4.0109    2.0576
  up-and-out call:   2.6789    2.3580    2.3453
   up-and-in call:  14.1112    8.4482    4.5910
down-and-out put:   2.2798    2.2947    2.6252
 down-and-in put:   2.9586    6.5677   11.9752
  up-and-out put:   3.7760    5.4932    7.5187
   up-and-in put:   1.4653    3.3721    7.0846
Knock-in plus knock-out is the vanilla option#
S = np.linspace(60.0, 140.0, 300)
T, r, sigma, Kc = 1.0, 0.05, 0.3, 100.0
fig, axes = plt.subplots(1, 2, figsize=(12, 4), sharey=True)
for ax, direction, H in ((axes[0], "down", 85.0), (axes[1], "up", 125.0)):
    out = barrier_price(S, Kc, H, T, r, sigma, barrier_type=f"{direction}-and-out")
    inn = barrier_price(S, Kc, H, T, r, sigma, barrier_type=f"{direction}-and-in")
    ax.plot(S, out, label=f"{direction}-and-out")
    ax.plot(S, inn, label=f"{direction}-and-in")
    ax.plot(S, out + inn, "k--", lw=2, label="sum")
    ax.plot(S, black_scholes_price(S, Kc, T, r, sigma), ":", color="C3", lw=3, label="vanilla call")
    ax.axvline(H, color="0.5", lw=1)
    ax.set_xlabel("spot S")
    ax.set_title(f"{direction} barrier H = {H:g}")
    ax.legend()
axes[0].set_ylabel("value")
fig.tight_layout()
plt.show()
Total running time of the script: (0 minutes 0.081 seconds)
