
Note
Go to the end to download the full example code or to run this example in your browser via JupyterLite.
Rubinstein choosers#
“Pay now, choose later”: the holder of a simple chooser decides at a date \(t\) whether the option is a call or a put, both struck at \(K\) and expiring at \(T\). Mark Rubinstein (1991) used put-call parity to write the choice as a call plus a put:
\[\max(c, p) = c + (K e^{-r(T-t)} - S_t e^{-q(T-t)})^+
\;\Rightarrow\; V = c(S, K, T) + e^{-q(T-t)}\, p(S, K e^{-(r-q)(T-t)}, t).\]
Choosing today is worth the better of the two options; choosing at expiry is a straddle. In between the value rises with the time left to choose.
import matplotlib.pyplot as plt
import numpy as np

from financialkit.exotic_options import chooser_price
from financialkit.options import black_scholes_price

S, T, r, sigma = 100.0, 1.0, 0.05, 0.25
print(f"Haug (2007), 4.4.1: {chooser_price(50.0, 50.0, 0.25, 0.5, 0.08, 0.25):.4f}")
t = np.linspace(0.0, T, 60)

fig, axes = plt.subplots(1, 2, figsize=(12, 4))
for K in (90.0, 100.0, 110.0):
    line = axes[0].plot(t, chooser_price(S, K, t, T, r, sigma), label=f"K = {K:g}")[0]
    c, p = black_scholes_price(S, K, T, r, sigma), black_scholes_price(S, K, T, r, sigma, option_type="put")
    axes[0].plot([0, T], [max(c, p), c + p], "o", color=line.get_color())
axes[0].set_xlabel("choice date t (dots: better option, straddle)")
axes[0].set_ylabel("chooser value")
axes[0].legend()
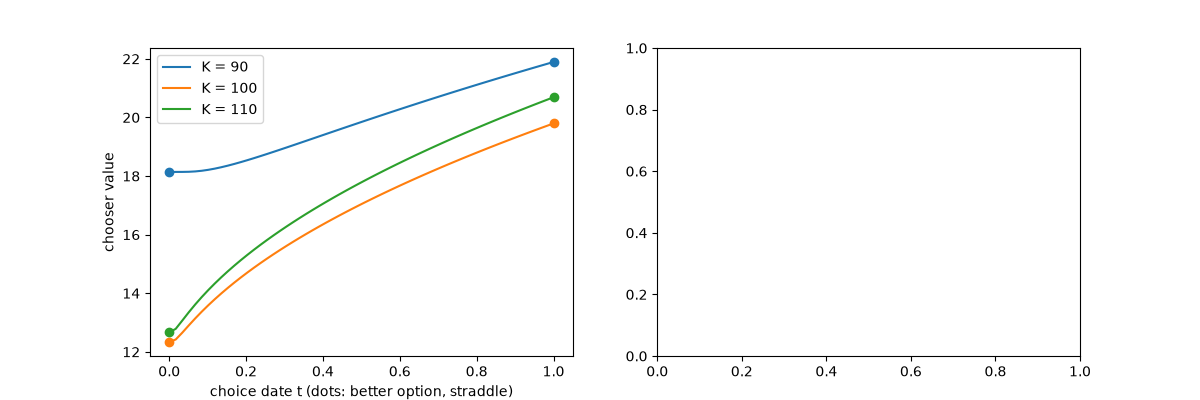
Haug (2007), 4.4.1: 6.1071

<matplotlib.legend.Legend object at 0x116f11be0>
A Monte Carlo check of the decision rule#
K, tc = 100.0, 0.5
rng = np.random.default_rng(0)
z = rng.standard_normal((2, 50_000))
St = S * np.exp((r - 0.5 * sigma**2) * tc + sigma * np.sqrt(tc) * z[0])
ST = St * np.exp((r - 0.5 * sigma**2) * (T - tc) + sigma * np.sqrt(T - tc) * z[1])
pick_call = black_scholes_price(St, K, T - tc, r, sigma) >= black_scholes_price(St, K, T - tc, r, sigma, option_type="put")
y = np.exp(-r * T) * np.where(pick_call, np.maximum(ST - K, 0), np.maximum(K - ST, 0))
print(f"chooser {chooser_price(S, K, tc, T, r, sigma):.4f}, Monte Carlo {y.mean():.4f} +/- {y.std() / np.sqrt(y.size):.4f}")
axes[1].hist(St[pick_call], bins=60, alpha=0.6, label="choose the call")
axes[1].hist(St[~pick_call], bins=60, alpha=0.6, label="choose the put")
axes[1].set_xlabel(f"price at the choice date t = {tc}")
axes[1].legend()
fig.tight_layout()
plt.show()
chooser 17.0412, Monte Carlo 17.0335 +/- 0.0811
Total running time of the script: (0 minutes 0.085 seconds)
