
Note
Go to the end to download the full example code or to run this example in your browser via JupyterLite.
Goldman-Sosin-Gatto floating lookbacks#
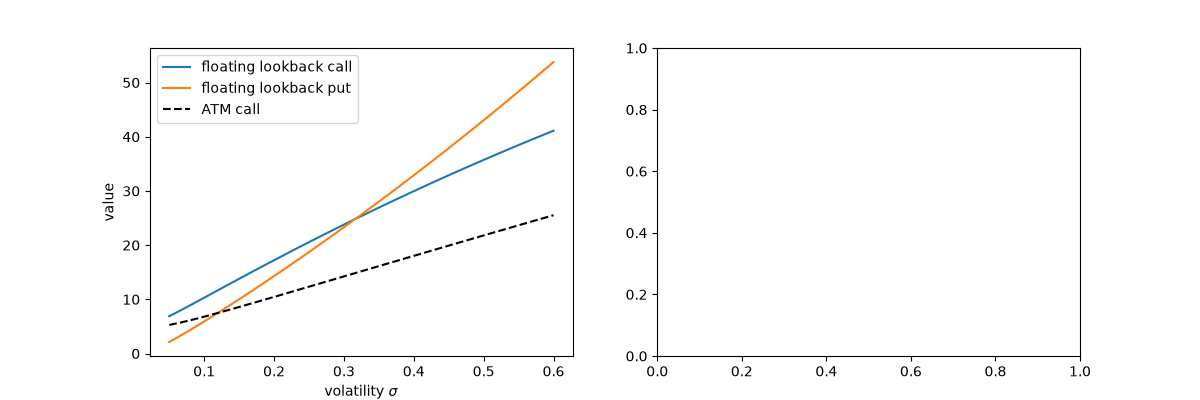
“Buy at the low, sell at the high”: Barry Goldman, Howard Sosin and Mary Ann Gatto (1979) priced the option whose strike is the lowest price over its life, \(S_T - \min_t S_t\) (or the highest, for the put). It is never out of the money, so it costs much more than a vanilla call. The joint law of a Brownian motion and its minimum gives the closed form; Monte Carlo can match it exactly only by sampling each step’s minimum from the Brownian bridge, because checking the price at discrete dates misses the true low.
import matplotlib.pyplot as plt
import numpy as np

from financialkit.exotic_options import floating_lookback_price, lookback_option_mc
from financialkit.options import black_scholes_price

S, T, r, sigma = 100.0, 1.0, 0.05, 0.25
print(f"Haug (2007), 4.15.1: {floating_lookback_price(120.0, 0.5, 0.10, 0.30, q=0.06, S_extreme=100.0):.4f}")
Haug (2007), 4.15.1: 25.3534
Lookback against at-the-money vanilla options#
vols = np.linspace(0.05, 0.6, 40)
fig, axes = plt.subplots(1, 2, figsize=(12, 4))
axes[0].plot(vols, floating_lookback_price(S, T, r, vols), label="floating lookback call")
axes[0].plot(vols, floating_lookback_price(S, T, r, vols, option_type="put"), label="floating lookback put")
axes[0].plot(vols, black_scholes_price(S, S, T, r, vols), "k--", label="ATM call")
axes[0].set_xlabel(r"volatility $\sigma$")
axes[0].set_ylabel("value")
axes[0].legend()
<matplotlib.legend.Legend object at 0x116c67cb0>
Discrete monitoring misses the minimum; the bridge does not#
steps = np.array([2, 4, 8, 16, 32, 64])
exact = floating_lookback_price(S, T, r, sigma)
for continuous, label in ((False, "minimum over the grid"), (True, "bridge-sampled minimum")):
    res = [lookback_option_mc(S, T, r, sigma, n_steps=int(m), n_paths=20_000, continuous=continuous, rng=int(m)) for m in steps]
    axes[1].errorbar(steps, [x.estimate for x in res], yerr=[2 * x.std_error for x in res], fmt="o-", capsize=3, label=label)
axes[1].axhline(exact, color="k", lw=1, label="closed form")
axes[1].set_xscale("log", base=2)
axes[1].set_xlabel("time steps")
axes[1].set_ylabel("floating lookback call")
axes[1].legend()
fig.tight_layout()
plt.show()
Total running time of the script: (0 minutes 0.159 seconds)
