
Note
Go to the end to download the full example code or to run this example in your browser via JupyterLite.
Demeterfi-Derman-Kamal-Zou variance swaps#
A variance swap pays the realized variance of the returns minus a fixed strike. Kresimir Demeterfi, Emanuel Derman, Michael Kamal and Joseph Zou (1999) showed how to replicate it, whatever the volatility process, with a static strip of out-of-the-money options weighted by \(1/K^2\) plus a delta hedge, which gives the fair strike from today’s option prices alone:
\[K_{\mathrm{var}} = \frac{2e^{rT}}{T}\left[\int_0^{F}\frac{P(K)}{K^2}dK + \int_F^\infty \frac{C(K)}{K^2}dK\right].\]
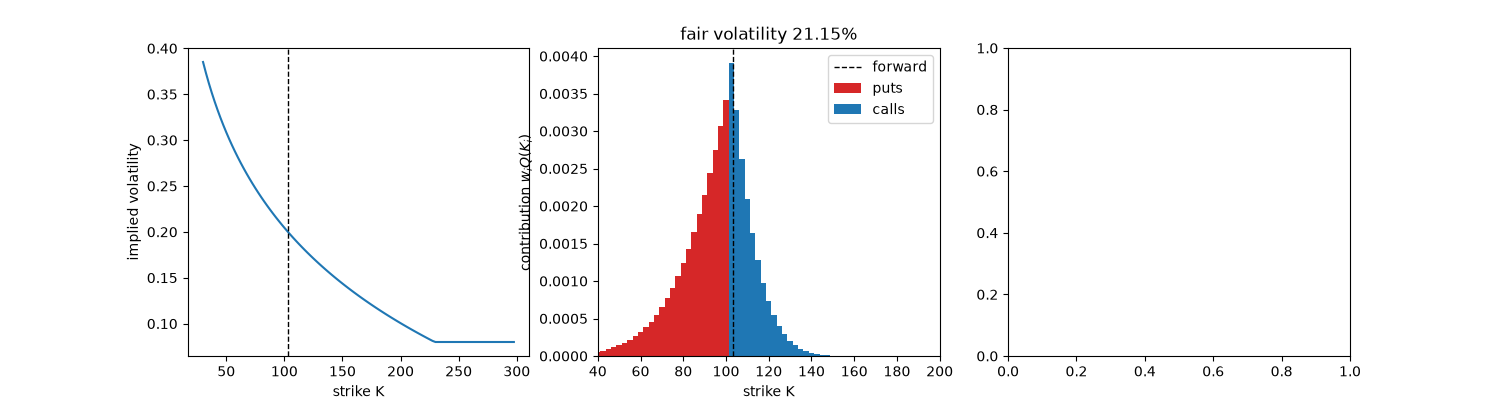
The same formula, discretised, is the VIX. With a downward skew the cheap-looking puts carry high implied volatility, and the fair variance lies above the at-the-money volatility squared.
import matplotlib.pyplot as plt
import numpy as np

from financialkit.exotic_options import plot_variance_strip, realized_variance, variance_swap_strike
from financialkit.integrators import gbm_paths
from financialkit.options import black_scholes_price

S, T, r = 100.0, 1.0, 0.03
F = S * np.exp(r * T)
K = np.arange(30.0, 300.0, 2.5)


def skew(k):
    return np.clip(0.2 - 0.15 * np.log(k / F), 0.08, None)


def strip(vol):
    c, p = (black_scholes_price(S, K, T, r, vol, option_type=t) for t in ("call", "put"))
    return variance_swap_strike(K, c, p, S, T, r)


flat, skewed = strip(0.2), strip(skew(K))
print(f"flat 20% smile: fair volatility {flat.vol_strike:.4f}")
print(f"skewed smile (ATM 20%): fair volatility {skewed.vol_strike:.4f}")
flat 20% smile: fair volatility 0.2003
skewed smile (ATM 20%): fair volatility 0.2115
The replicating strip under the skew#
(40.0, 200.0)
Under Black-Scholes, realized variance averages to the fair strike#
_, paths = gbm_paths(S, r, 0.2, T, 252, 5000, rng=0)
rv = realized_variance(paths, T)
axes[2].hist(rv, bins=50, density=True, alpha=0.7)
axes[2].axvline(flat.fair_variance, color="k", lw=2, label=f"fair strike {flat.fair_variance:.4f}")
axes[2].axvline(rv.mean(), color="C3", ls="--", label=f"mean realized {rv.mean():.4f}")
axes[2].set_xlabel("realized variance (daily returns)")
axes[2].legend()
fig.tight_layout()
plt.show()
Total running time of the script: (0 minutes 0.152 seconds)
