
Note
Go to the end to download the full example code or to run this example in your browser via JupyterLite.
Garman’s order-flow dealer#
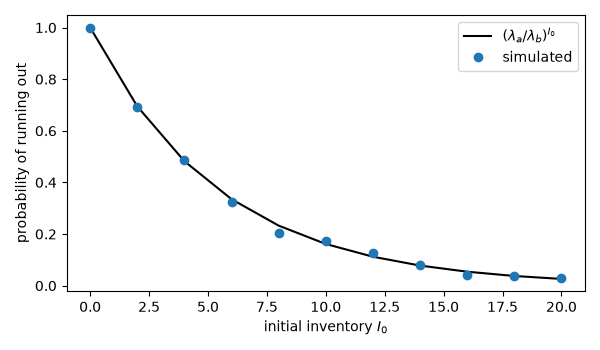
Mark Garman (1976) started market microstructure by modelling orders as Poisson streams: buyers arrive at rate \(\lambda_a(a)\), falling with the ask, and sellers at \(\lambda_b(b)\), rising with the bid. A monopolist dealer holding stock and cash fails when either runs out. The stock follows a gambler’s-ruin walk, so the probability of eventually running out of shares is \((\lambda_a/\lambda_b)^{I_0}\) when sellers outnumber buyers, and one otherwise. Keeping both stock and cash growing requires \(\lambda_b > \lambda_a\) and \(a\lambda_a > b\lambda_b\), hence \(a > b\): the dealer must set a spread.
import matplotlib.pyplot as plt
import numpy as np

from financialkit.market_microstructure import garman_ruin_probability, simulate_garman
from financialkit.market_microstructure.visualizers import plot_garman
Running out of stock#
Sellers arrive at 1.2 per minute and buyers at 1.0, so the inventory drifts upward; cash is unlimited here. Simulation agrees with the closed form.
starts = np.arange(0, 21, 2)
sim = [simulate_garman(int(i), np.inf, 1.0, 1.0, 1.0, 1.2, n_events=1500, n_paths=800, rng=int(i)).failed.mean() for i in starts]
fig, ax = plt.subplots(figsize=(6, 3.5))
ax.plot(starts, garman_ruin_probability(starts, 1.0, 1.2), "k-", label=r"$(\lambda_a/\lambda_b)^{I_0}$")
ax.plot(starts, sim, "o", color="C0", label="simulated")
ax.set_xlabel("initial inventory $I_0$")
ax.set_ylabel("probability of running out")
ax.legend()
fig.tight_layout()
Without a spread the dealer fails#
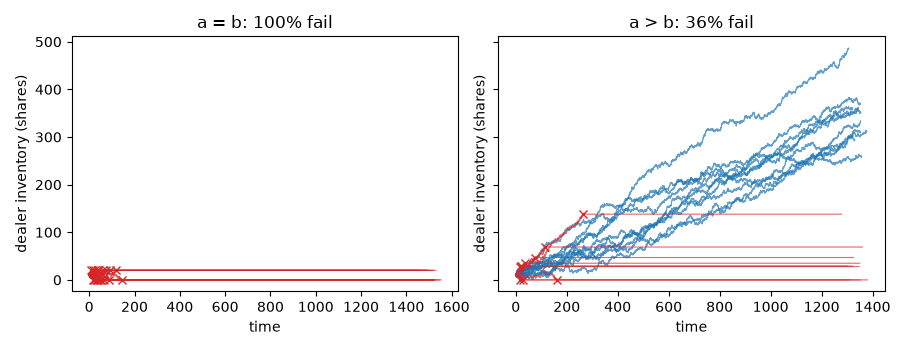
At equal quotes the order flow that keeps stock from falling drains cash, and vice versa. A spread with a little more selling than buying lets both grow.
flat = simulate_garman(10, 10.0, 1.0, 1.0, 1.0, 1.0, n_events=3000, n_paths=200, rng=0)
wide = simulate_garman(10, 10.0, 1.2, 0.8, 1.0, 1.25, n_events=3000, n_paths=200, rng=0)
fig, axes = plt.subplots(1, 2, figsize=(9, 3.5), sharey=True)
plot_garman(flat, ax=axes[0])
axes[0].set_title(f"a = b: {flat.failed.mean():.0%} fail")
plot_garman(wide, ax=axes[1])
axes[1].set_title(f"a > b: {wide.failed.mean():.0%} fail")
fig.tight_layout()

plt.show()
Total running time of the script: (0 minutes 0.364 seconds)
