
Note
Go to the end to download the full example code or to run this example in your browser via JupyterLite.
Roll’s spread estimator#
Richard Roll (1984) noticed that trades bouncing between bid and ask make successive price changes negatively correlated even when the underlying value is a random walk. With equally likely buys and sells, \(\operatorname{cov}(\Delta p_t, \Delta p_{t-1}) = -s^2/4\), so the spread can be read off a price series with no quotes at all:
\[\hat s = 2\sqrt{-\widehat{\operatorname{cov}}(\Delta p_t, \Delta p_{t-1})}.\]
import matplotlib.pyplot as plt
import numpy as np

from financialkit.market_microstructure import roll_spread
from financialkit.time_series import autocorrelation

rng = np.random.default_rng(1)


def trades(n, s, sigma, rng):
    value = 50 + sigma * rng.standard_normal(n).cumsum()
    return value + 0.5 * s * rng.choice([-1.0, 1.0], n)
The bounce in the autocorrelations#
p = trades(20000, 0.10, 0.02, rng)
acf = autocorrelation(np.diff(p), 5)
print(f"first-order autocorrelation of price changes: {acf[1]:.3f}")
print(f"Roll estimate {roll_spread(p):.4f} against a true spread of 0.1")

fig, ax = plt.subplots(figsize=(6, 3))
ax.bar(range(1, 6), acf[1:], color="C0")
ax.axhline(0, color="k", lw=0.8)
ax.set_xlabel("lag")
ax.set_ylabel("autocorrelation of price changes")
fig.tight_layout()
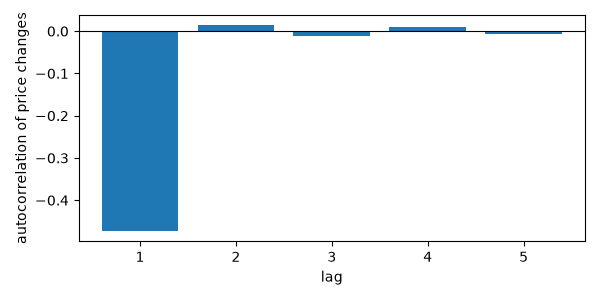
first-order autocorrelation of price changes: -0.473
Roll estimate 0.1010 against a true spread of 0.1
Accuracy across spreads and sample sizes#
When value changes are large next to the bounce (here 5 cents a trade) the estimate is noisy, and in short samples with a tight spread the sample autocovariance is often positive and the estimator undefined.
spreads = np.array([0.02, 0.05, 0.1, 0.2])
fig, ax = plt.subplots(figsize=(6, 4))
for n, color in [(250, "C1"), (5000, "C0")]:
    est = np.array([[roll_spread(trades(n, s, 0.05, rng)) for _ in range(200)] for s in spreads])
    ax.errorbar(spreads, np.nanmean(est, axis=1), yerr=np.nanstd(est, axis=1), fmt="o-", color=color, capsize=3, label=f"{n} trades")
    print(f"{n} trades: undefined in", ", ".join(f"{np.isnan(e).mean():.0%}" for e in est))
ax.plot(spreads, spreads, "k--", label="true spread")
ax.set_xlabel("true spread")
ax.set_ylabel("Roll estimate (mean and sd)")
ax.legend()
fig.tight_layout()

plt.show()
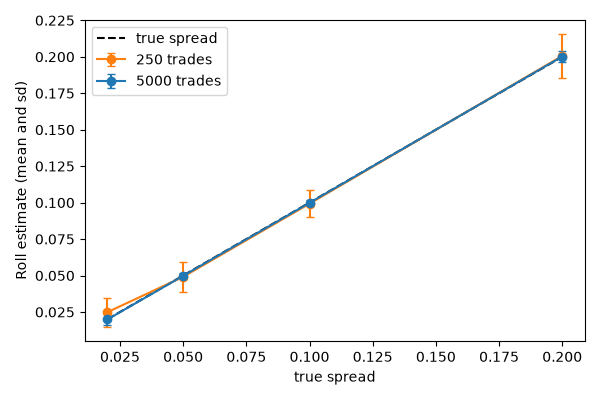
250 trades: undefined in 19%, 0%, 0%, 0%
5000 trades: undefined in 0%, 0%, 0%, 0%
Total running time of the script: (0 minutes 0.174 seconds)
