
Note
Go to the end to download the full example code or to run this example in your browser via JupyterLite.
Black and Jones’s constant proportion portfolio insurance#
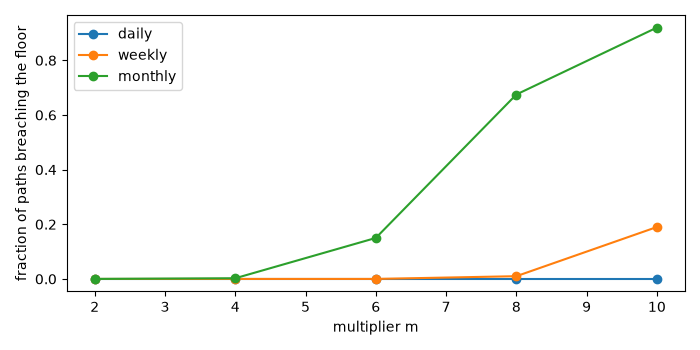
Fischer Black and Robert Jones (1987) proposed a simple rule for protecting a floor: hold \(m\) times the cushion (wealth above the floor) in stocks and the rest in bonds. When stocks fall the cushion shrinks and so does the exposure, so under continuous trading wealth never touches the floor; Black and Perold (1992) showed the cushion is then a power \(m\) of the stock price. With discrete rebalancing, a fall of more than \(1/m\) between trades breaks through the floor: gap risk.
import matplotlib.pyplot as plt
import numpy as np

from financialkit.integrators import gbm_paths
from financialkit.portfolio import cppi, cppi_continuous
from financialkit.portfolio.visualizers import plot_cppi

mu, sigma, r = 0.07, 0.25, 0.02
times, S = gbm_paths(100.0, mu, sigma, 3.0, 3 * 252, 400, rng=1)
Daily rebalancing with multiplier 4#
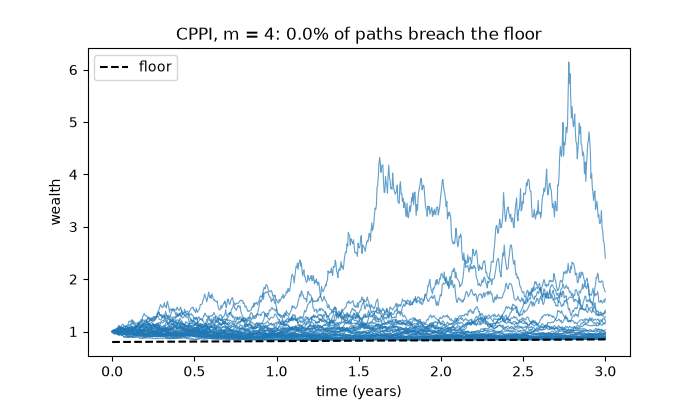
<Axes: title={'center': 'CPPI, m = 4: 0.0% of paths breach the floor'}, xlabel='time (years)', ylabel='wealth'>
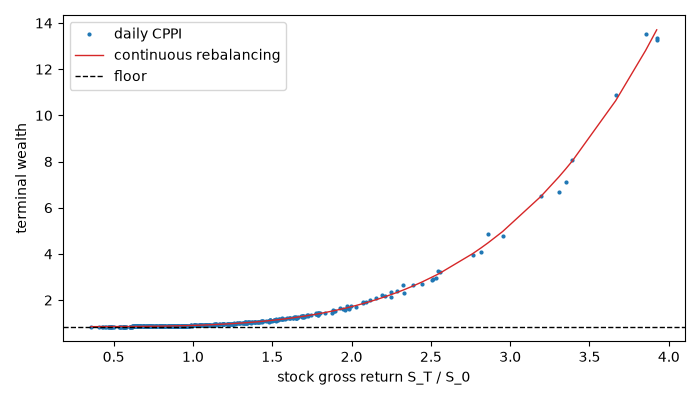
The payoff is convex in the stock#
Terminal wealth against the stock’s return: the discrete strategy hugs Black and Perold’s closed form \(F_T + C_0 (S_T/S_0)^m e^{(1-m)(r + m\sigma^2/2)T}\).
exact = cppi_continuous(S, times, sigma, floor=0.8, multiplier=4.0, r=r)
fig, ax = plt.subplots(figsize=(7, 4))
x = S[:, -1] / S[:, 0]
ax.plot(x, res.wealth[:, -1], ".", ms=4, label="daily CPPI")
order = np.argsort(x)
ax.plot(x[order], exact[order, -1], "C3", lw=1, label="continuous rebalancing")
ax.axhline(res.floor[-1], color="k", ls="--", lw=1, label="floor")
ax.set_xlabel("stock gross return S_T / S_0")
ax.set_ylabel("terminal wealth")
ax.legend()
fig.tight_layout()
Gap risk grows with the multiplier and the rebalancing interval#
fig, ax = plt.subplots(figsize=(7, 3.5))
for step, label in [(1, "daily"), (5, "weekly"), (21, "monthly")]:
    breach = [cppi(S[:, ::step], times[::step], 0.8, m, r).breached.mean() for m in [2, 4, 6, 8, 10]]
    ax.plot([2, 4, 6, 8, 10], breach, "o-", label=label)
ax.set_xlabel("multiplier m")
ax.set_ylabel("fraction of paths breaching the floor")
ax.legend()
fig.tight_layout()
plt.show()
Total running time of the script: (0 minutes 0.141 seconds)
