
Note
Go to the end to download the full example code or to run this example in your browser via JupyterLite.
Demarta-McNeil: the t copula and tail dependence#
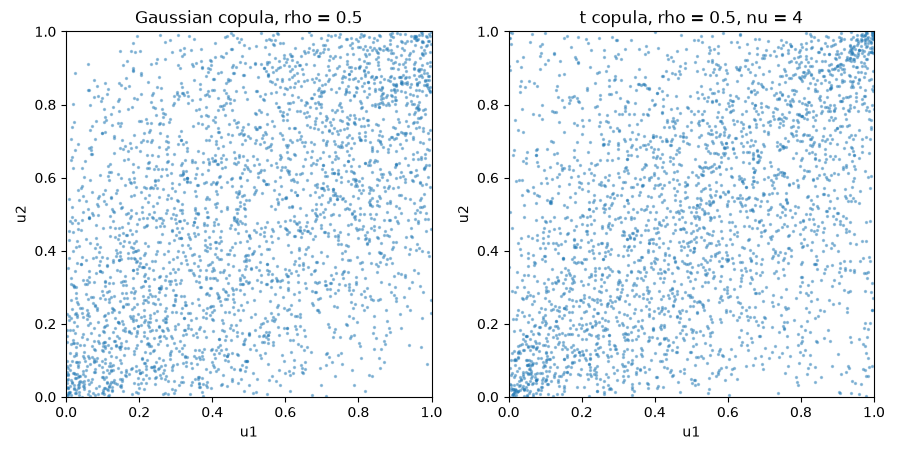
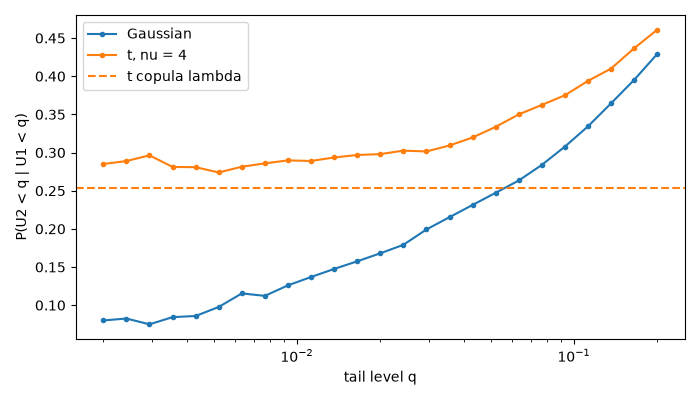
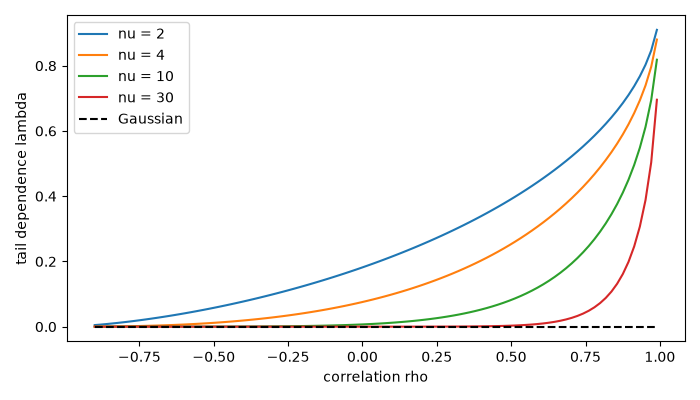
Under a Gaussian copula, joint extremes become independent as one looks further into the tail: the coefficient of tail dependence is zero for any correlation below one. Markets do not behave that way; in a crash everything falls together. Demarta and McNeil (2005) studied the t copula, whose shared random scale makes extremes coincide with probability
\[\lambda = 2\, t_{\nu + 1}\left(-\sqrt{\frac{(\nu + 1)(1 - \rho)}{1 + \rho}}\right) > 0,\]
even for zero or negative correlation.
import matplotlib.pyplot as plt
import numpy as np

from financialkit.risk import empirical_tail_dependence, gaussian_copula_sample, t_copula_sample, t_tail_dependence
from financialkit.risk.visualizers import plot_copula

corr = np.array([[1.0, 0.5], [0.5, 1.0]])
n = 100_000
g = gaussian_copula_sample(corr, n, rng=0)
t = t_copula_sample(corr, 4, n, rng=1)
Same correlation, different corners#
Tail dependence as the level shrinks#
\(P(U_2 < q \mid U_1 < q)\) falls towards zero for the Gaussian copula and levels off at \(\lambda\) for the t copula.
q = np.geomspace(0.002, 0.2, 25)
fig, ax = plt.subplots(figsize=(7, 4))
ax.semilogx(q, empirical_tail_dependence(*g.T, q), "o-", ms=3, label="Gaussian")
ax.semilogx(q, empirical_tail_dependence(*t.T, q), "o-", ms=3, label="t, nu = 4")
ax.axhline(t_tail_dependence(0.5, 4), color="C1", ls="--", label="t copula lambda")
ax.set_xlabel("tail level q")
ax.set_ylabel("P(U2 < q | U1 < q)")
ax.legend()
fig.tight_layout()
The coefficient across correlation and degrees of freedom#
rho = np.linspace(-0.9, 0.99, 100)
fig, ax = plt.subplots(figsize=(7, 4))
for nu in (2, 4, 10, 30):
    ax.plot(rho, t_tail_dependence(rho, nu), label=f"nu = {nu}")
ax.plot(rho, t_tail_dependence(rho, np.inf), "k--", label="Gaussian")
ax.set_xlabel("correlation rho")
ax.set_ylabel("tail dependence lambda")
ax.legend()
fig.tight_layout()

plt.show()
Total running time of the script: (0 minutes 0.254 seconds)
