
Note
Go to the end to download the full example code or to run this example in your browser via JupyterLite.
Peaks over threshold: Pickands-Balkema-de Haan#
Pickands (1975) and Balkema and de Haan (1974) proved that the excess of a loss over a high threshold \(u\) is approximately generalized Pareto, whatever the parent distribution in the Fréchet, Gumbel or Weibull domain. Fitting that law to the few largest losses gives VaR and expected shortfall at levels the data barely reach:
\[\mathrm{VaR}_\alpha = u + \frac{\beta}{\xi}\left[\left(\frac{n}{N_u}(1 - \alpha)\right)^{-\xi} - 1\right].\]
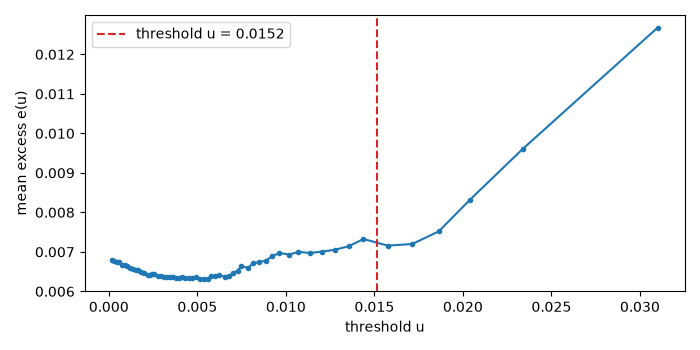
The threshold is chosen where the mean excess plot turns linear.
import matplotlib.pyplot as plt
import numpy as np
from scipy import stats

from financialkit.risk import fit_pot, historical_var, mean_excess, pot_es, pot_var
from financialkit.risk.visualizers import plot_pot_tail

rng = np.random.default_rng(0)
nu = 4.0
pnl = 0.01 * stats.t(nu).rvs(5000, random_state=rng) / np.sqrt(nu / (nu - 2))
truth = stats.t(nu, scale=0.01 / np.sqrt(nu / (nu - 2)))
Choosing the threshold#
The mean excess of a GPD tail rises linearly with slope \(\xi/(1 - \xi)\). Above roughly the 95th loss percentile the plot straightens; we put the threshold there.
u_grid = np.quantile(-pnl, np.linspace(0.5, 0.995, 60))
u = float(np.quantile(-pnl, 0.95))
fig, ax = plt.subplots(figsize=(7, 3.5))
ax.plot(u_grid, mean_excess(pnl, u_grid), ".-")
ax.axvline(u, color="C3", ls="--", label=f"threshold u = {u:.4f}")
ax.set_xlabel("threshold u")
ax.set_ylabel("mean excess e(u)")
ax.legend()
fig.tight_layout()
Tail fit and extrapolated risk#
fit = fit_pot(pnl, u)
print(f"xi = {fit.xi:.3f} (true 1/nu = {1 / nu:.3f}), beta = {fit.beta:.4f}, {fit.n_exceed} exceedances")
print(" alpha     POT VaR   hist VaR  true VaR    POT ES")
for a in (0.99, 0.995, 0.999, 0.9999):
    print(f"{a:6.4f}  {pot_var(fit, a):9.4f}  {historical_var(pnl, a).var:9.4f}  {truth.ppf(a):8.4f}  {pot_es(fit, a):8.4f}")
plot_pot_tail(fit)

plt.show()
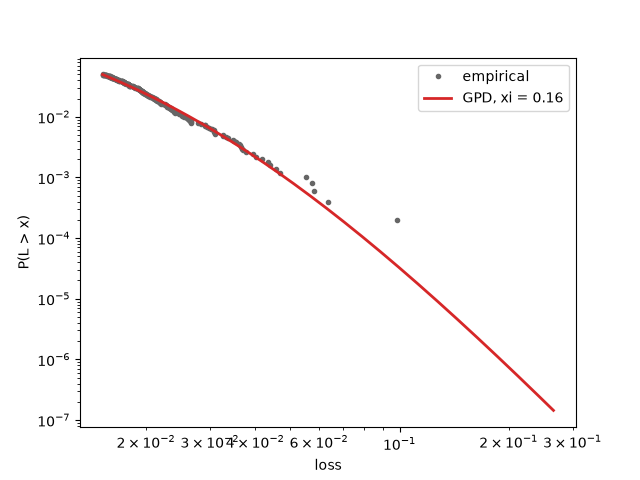
xi = 0.157 (true 1/nu = 0.250), beta = 0.0061, 250 exceedances
 alpha     POT VaR   hist VaR  true VaR    POT ES
0.9900     0.0264     0.0255    0.0265    0.0358
0.9950     0.0322     0.0326    0.0326    0.0427
0.9990     0.0483     0.0551    0.0507    0.0618
0.9999     0.0798     0.0987    0.0922    0.0992
Total running time of the script: (0 minutes 0.093 seconds)
