
Note
Go to the end to download the full example code or to run this example in your browser via JupyterLite.
Lord, Koekkoek and van Dijk’s full truncation#
An Euler step for the square-root variance can go negative, and the
repairs proposed in the literature differ in where they take the
positive part: in the diffusion only (partial truncation, Deelstra and
Delbaen 1998), as an absolute value in the diffusion (Higham and Mao
2005), or in both the drift and the diffusion while letting the
variance itself go negative (full truncation). Lord, Koekkoek and van
Dijk (2010) put them in one framework and found full truncation the
least biased. All three schemes here run through
financialkit.integrators.euler_maruyama() with correlated increments.
import matplotlib.pyplot as plt
import numpy as np

from financialkit.stochastic_volatility import HestonModel, heston_mc_price, heston_paths
from financialkit.stochastic_volatility.visualizers import plot_heston_paths

m = HestonModel(v0=0.04, kappa=0.5, theta=0.04, xi=1.0, rho=-0.9)
S, K, T, r = 100.0, 100.0, 10.0, 0.0
exact = m.price(S, K, T, r)

# Higham-Mao's absolute value keeps feeding large variances back in, so
# its estimates are both biased and very noisy.

steps = np.array([10, 20, 40, 80])
fig, ax = plt.subplots(figsize=(7, 4))
for scheme in ("full_truncation", "partial_truncation", "higham_mao"):
    res = [heston_mc_price(m, S, K, T, r, n_steps=n, n_paths=20_000, scheme=scheme, rng=3) for n in steps]
    bias = np.array([x.estimate - exact for x in res])
    se = np.array([x.std_error for x in res])
    print(f"{scheme:>18}: bias {np.round(bias, 2)}, standard error {np.round(se, 2)}")
    ax.errorbar(T / steps, bias, yerr=2 * se, marker="o", ms=3, capsize=2, label=scheme)
ax.axhline(0.0, color="k", lw=0.8)
ax.set_xscale("log")
ax.set_ylim(-15, 15)
ax.set_xlabel("time step")
ax.set_ylabel("price bias (exact 13.0847)")
ax.legend()
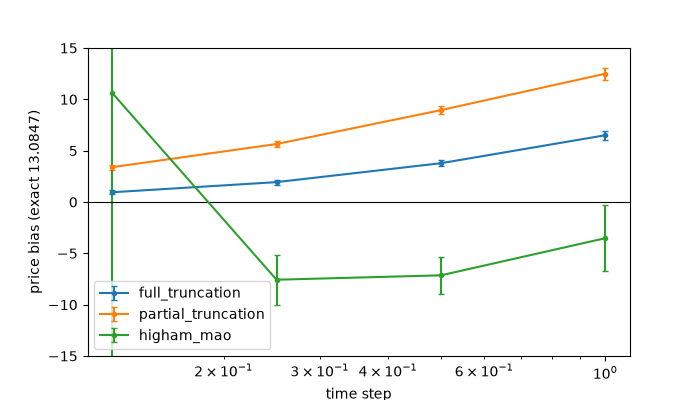
   full_truncation: bias [6.5  3.78 1.94 0.95], standard error [0.21 0.15 0.12 0.1 ]
partial_truncation: bias [12.5   8.95  5.65  3.39], standard error [0.3  0.21 0.16 0.13]
        higham_mao: bias [-3.52 -7.14 -7.57 10.62], standard error [ 1.62  0.89  1.22 15.36]

<matplotlib.legend.Legend object at 0x117d8ef90>
Full truncation lets the variance go negative#
The state \(v\) itself crosses zero, but only \(v^+\) enters the coefficients, so it drifts back up at rate \(\kappa\theta\).
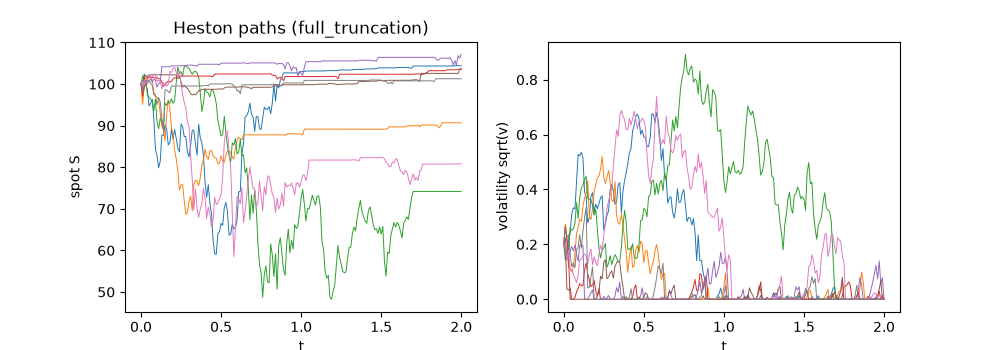
lowest simulated variance: -0.0107
Total running time of the script: (0 minutes 0.306 seconds)
