
Note
Go to the end to download the full example code or to run this example in your browser via JupyterLite.
Akaike information criterion#
Adding parameters always raises the likelihood, so the likelihood alone cannot choose a model’s order. Hirotugu Akaike (1974) showed that \(-2\ell + 2k\) estimates the expected Kullback-Leibler distance between the fitted model and the truth, so the order that minimizes it predicts best. Gideon Schwarz’s (1978) Bayesian criterion \(-2\ell + k\ln n\) penalizes more heavily and is consistent: it picks the true order with probability one as \(n \to \infty\), while AIC keeps a small chance of overfitting.
import matplotlib.pyplot as plt
import numpy as np

from financialkit.time_series import select_arma_order, simulate_arma
The criteria over a grid of orders#
For a simulated AR(2), every ARMA(p, q) up to (5, 2) is fitted on the same sample. Both criteria bottom out at the true order.
x = simulate_arma(ar=[0.6, -0.3], n=800, rng=1974)
sel = select_arma_order(x, max_p=5, max_q=2)
print("AIC choice:", sel.best("aic"), " BIC choice:", sel.best("bic"))

fig, axes = plt.subplots(1, 2, figsize=(9, 3.5), sharey=True)
for ax, name, grid in zip(axes, ("AIC", "BIC"), (sel.aic, sel.bic), strict=True):
    im = ax.imshow(grid - np.nanmin(grid), origin="lower", cmap="viridis_r", vmax=40, aspect="auto")
    p, q = sel.best(name.lower())
    ax.plot(q, p, "r*", ms=14)
    ax.set_xlabel("MA order q")
    ax.set_title(f"{name} minus its minimum")
axes[0].set_ylabel("AR order p")
fig.colorbar(im, ax=axes)
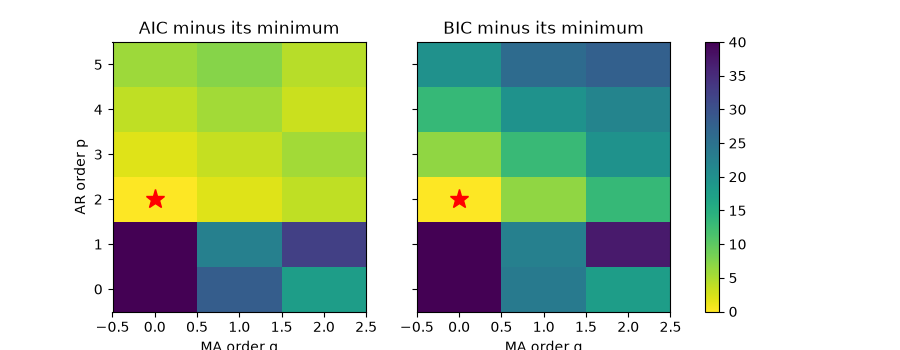
AIC choice: (2, 0)  BIC choice: (2, 0)

<matplotlib.colorbar.Colorbar object at 0x116d87a10>
How often each criterion overfits#
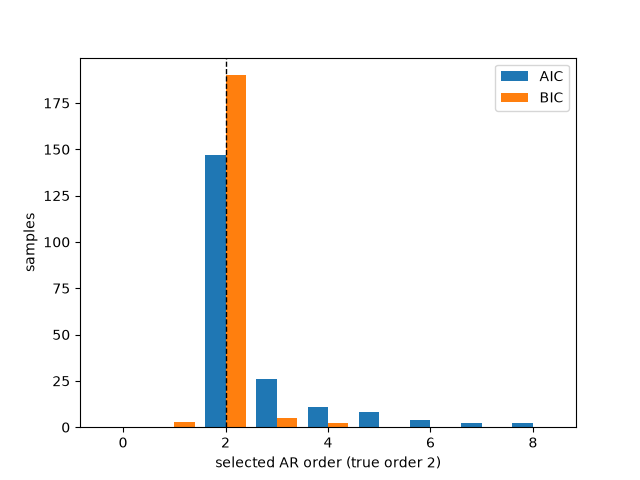
Over 200 short AR(2) samples, choosing among pure AR orders 0..8, BIC lands on 2 more often; AIC’s lighter penalty lets extra lags in now and then.
rng = np.random.default_rng(0)
picks = {"aic": [], "bic": []}
for _ in range(200):
    s = select_arma_order(simulate_arma(ar=[0.6, -0.3], n=200, rng=rng), max_p=8, max_q=0)
    for c in picks:
        picks[c].append(s.best(c)[0])

fig, ax = plt.subplots()
bins = np.arange(10) - 0.5
ax.hist([picks["aic"], picks["bic"]], bins=bins, label=["AIC", "BIC"])
ax.axvline(2, color="k", ls="--", lw=1)
ax.set_xlabel("selected AR order (true order 2)")
ax.set_ylabel("samples")
ax.legend()
plt.show()
Total running time of the script: (0 minutes 0.196 seconds)
