
Note
Go to the end to download the full example code or to run this example in your browser via JupyterLite.
Mandelbrot: fat tails#
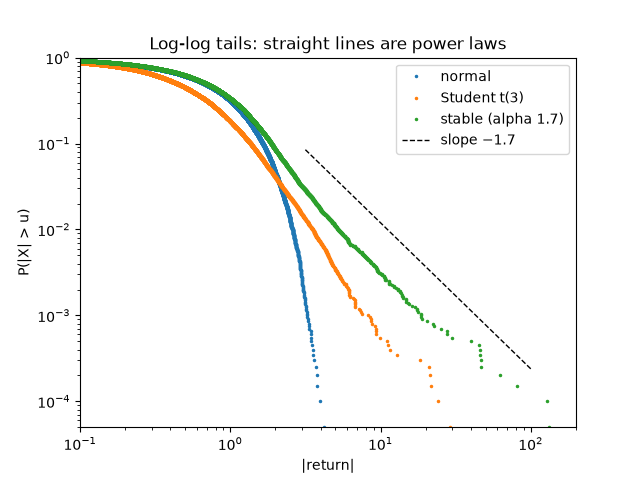
Benoit Mandelbrot (1963) plotted the frequency of large changes in cotton prices on doubly logarithmic paper and found straight lines: the tail probability \(P(|X| > u)\) decays like a power \(u^{-\alpha}\), not like the Gaussian \(e^{-u^2/2}\). Five-sigma days, which a normal distribution makes once-in-several-millennia events, happen every few years. He proposed the stable (Lévy) laws, with \(\alpha \approx 1.7\) for cotton; later work settled on tail indices between 3 and 5 for most returns, but the log-log plot remains the standard diagnostic.
import matplotlib.pyplot as plt
import numpy as np
from scipy import stats

from financialkit.time_series import return_statistics
from financialkit.time_series.visualizers import plot_tail
Three samples with the same scale#
Daily “returns” from a normal, a Student t with 3 degrees of freedom, and a symmetric stable law with Mandelbrot’s \(\alpha = 1.7\).
rng = np.random.default_rng(1963)
n = 20_000
samples = {
    "normal": rng.standard_normal(n),
    "Student t(3)": stats.t.rvs(3, size=n, random_state=rng) / np.sqrt(3),
    "stable (alpha 1.7)": stats.levy_stable.rvs(1.7, 0.0, size=n, random_state=rng) / np.sqrt(2),
}

fig, ax = plt.subplots()
for name, x in samples.items():
    plot_tail(x, ax=ax, label=name)
u = np.logspace(0.5, 2, 20)
ax.loglog(u, 0.6 * u**-1.7, "k--", lw=1, label=r"slope $-1.7$")
ax.set_ylim(1 / n, 1)
ax.set_xlim(0.1, 200)
ax.legend()
ax.set_title("Log-log tails: straight lines are power laws")
Text(0.5, 1.0, 'Log-log tails: straight lines are power laws')
Moments#
The normal sample has zero excess kurtosis; the fat-tailed ones have huge, unstable sample kurtosis (the stable law’s variance is infinite), and Jarque-Bera rejects normality at any level.
for name, x in samples.items():
    s = return_statistics(x)
    print(f"{name:22s} excess kurtosis {s.excess_kurtosis:9.1f}  JB p-value {s.jarque_bera_pvalue:.2g}")
normal                 excess kurtosis       0.0  JB p-value 0.23
Student t(3)           excess kurtosis      86.8  JB p-value 0
stable (alpha 1.7)     excess kurtosis    1268.7  JB p-value 0
How often are there 5-sigma days?#
normal                 one |move| > 5 sd every inf years
Student t(3)           one |move| > 5 sd every 1.3 years
stable (alpha 1.7)     one |move| > 5 sd every 1.6 years
normal theory          one every 6,922 years
Total running time of the script: (0 minutes 0.085 seconds)
