
Note
Go to the end to download the full example code or to run this example in your browser via JupyterLite.
Leland’s endogenous default and optimal leverage#
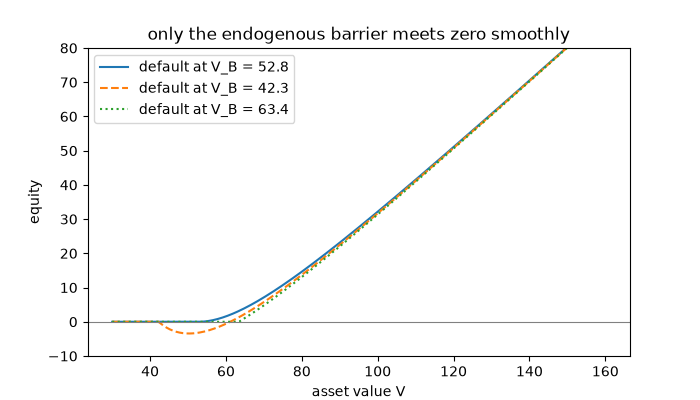
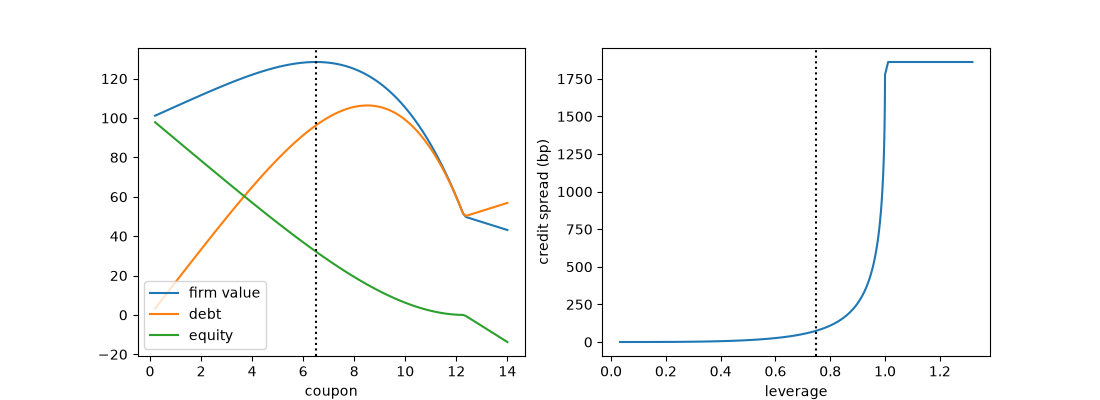
Leland (1994) priced perpetual debt on a firm whose coupons are tax deductible and whose bankruptcy destroys half its assets. Shareholders keep paying coupons as long as equity is worth something and default at the asset level \(V_B\) where equity hits zero with zero slope. Firm value, unlevered assets plus tax shields minus expected bankruptcy costs, is maximised at a coupon that sets the optimal leverage; in Leland’s base case this is about 75% with a 75 bp spread.
import matplotlib.pyplot as plt
import numpy as np

from financialkit.credit import leland_model, leland_optimal_coupon

r, sigma, tau, alpha = 0.06, 0.20, 0.35, 0.50
C_star, best = leland_optimal_coupon(100.0, r, sigma, tau, alpha)
print(f"optimal coupon {C_star:.2f}: leverage {best.leverage:.1%}, spread {1e4 * best.credit_spread:.0f} bp, V_B = {best.default_barrier:.1f}")
optimal coupon 6.50: leverage 75.0%, spread 75 bp, V_B = 52.8
Equity is an option that shareholders exercise by defaulting#
V = np.linspace(30, 160, 300)
fig, ax = plt.subplots(figsize=(7, 4))
for VB, ls in ((best.default_barrier, "-"), (0.8 * best.default_barrier, "--"), (1.2 * best.default_barrier, ":")):
    E = [leland_model(v, C_star, r, sigma, tau, alpha, VB).equity if v > VB else 0.0 for v in V]
    ax.plot(V, E, ls=ls, label=f"default at V_B = {VB:.1f}")
ax.axhline(0, color="0.5", lw=0.8)
ax.set_xlabel("asset value V")
ax.set_ylabel("equity")
ax.set_ylim(-10, 80)
ax.set_title("only the endogenous barrier meets zero smoothly")
ax.legend()
<matplotlib.legend.Legend object at 0x1165641a0>
The trade-off of capital structure#
coupons = np.linspace(0.2, 14, 120)
res = [leland_model(100.0, c, r, sigma, tau, alpha) for c in coupons]
fig, ax = plt.subplots(1, 2, figsize=(11, 4))
ax[0].plot(coupons, [x.firm_value for x in res], label="firm value")
ax[0].plot(coupons, [x.debt for x in res], label="debt")
ax[0].plot(coupons, [x.equity for x in res], label="equity")
ax[0].axvline(C_star, color="k", ls=":")
ax[0].set_xlabel("coupon")
ax[0].legend()
ax[1].plot([x.leverage for x in res], [1e4 * x.credit_spread for x in res])
ax[1].axvline(best.leverage, color="k", ls=":")
ax[1].set_xlabel("leverage")
ax[1].set_ylabel("credit spread (bp)")

plt.show()
Total running time of the script: (0 minutes 0.085 seconds)
