
Note
Go to the end to download the full example code or to run this example in your browser via JupyterLite.
Courant-Friedrichs-Lewy#
Courant, Friedrichs and Lewy (1928) proved that an explicit difference
scheme cannot converge if its time step outruns the way information
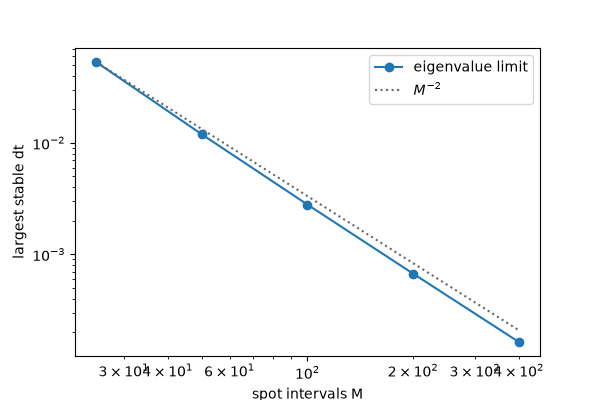
spreads across the grid. For the diffusion in the Black-Scholes equation
the bound ties the time step to the square of the spot step:
\(\Delta t \lesssim 1/(\sigma^2 M^2)\).
explicit_stability() computes the limit
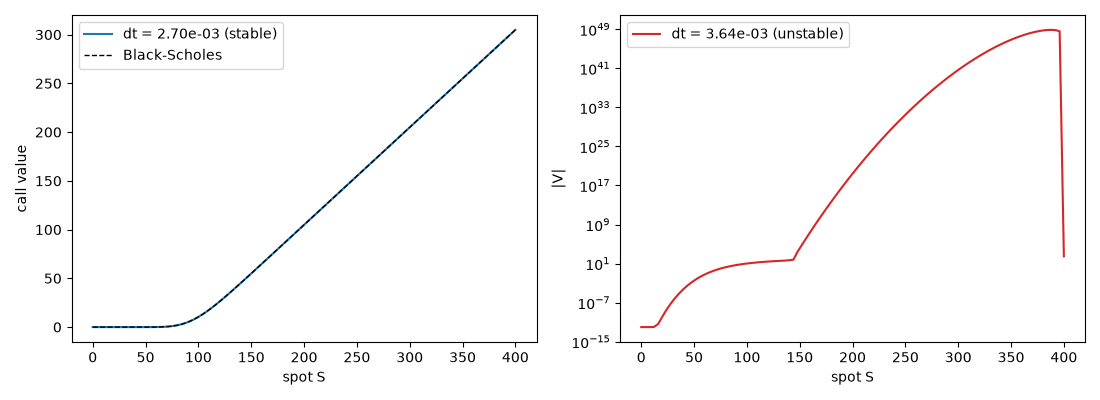
from the eigenvalues of the discrete operator; a step 3% below it gives
the right price, a step 30% above it blows up from rounding errors near
the top of the grid.
import matplotlib.pyplot as plt
import numpy as np

from financialkit.options import black_scholes_price
from financialkit.pde_methods import ExplicitScheme, explicit_stability

S, K, T, r, sigma, M = 100.0, 100.0, 1.0, 0.05, 0.2, 100
grid = np.linspace(0.0, 400.0, M + 1)
limit = explicit_stability(grid, 1.0, sigma, r).limit
print(f"largest stable step {limit:.3e} (1 / (sigma^2 (M-1)^2) = {1 / (sigma**2 * (M - 1) ** 2):.3e})")

below = ExplicitScheme(M, int(np.ceil(T / (0.97 * limit))), s_max=400.0).price(S, K, T, r, sigma)
above = ExplicitScheme(M, int(np.floor(T / (1.3 * limit))), s_max=400.0).price(S, K, T, r, sigma)
print(f"dt below the limit: price {below.price:.4f} (Black-Scholes {black_scholes_price(S, K, T, r, sigma):.4f})")
print(f"dt above the limit: max |V| on the grid {np.abs(above.V).max():.2e}")
largest stable step 2.792e-03 (1 / (sigma^2 (M-1)^2) = 2.551e-03)
dt below the limit: price 10.4136 (Black-Scholes 10.4506)
dt above the limit: max |V| on the grid 7.31e+48
Bounded below the limit, exploding above it#
fig, axes = plt.subplots(1, 2, figsize=(11, 4))
axes[0].plot(below.S, below.V, label=f"dt = {below.stability.number:.2e} (stable)")
axes[0].plot(below.S, black_scholes_price(below.S, K, T, r, sigma), "k--", lw=1, label="Black-Scholes")
axes[0].set_xlabel("spot S")
axes[0].set_ylabel("call value")
axes[0].legend()
axes[1].semilogy(above.S, np.abs(above.V) + 1e-12, color="C3", label=f"dt = {above.stability.number:.2e} (unstable)")
axes[1].set_xlabel("spot S")
axes[1].set_ylabel("|V|")
axes[1].legend()
fig.tight_layout()
plt.show()
Halving the spot step quarters the time step#
Ms = np.array([25, 50, 100, 200, 400])
limits = [explicit_stability(np.linspace(0.0, 400.0, m + 1), 1.0, sigma, r).limit for m in Ms]
fig, ax = plt.subplots(figsize=(6, 4))
ax.loglog(Ms, limits, "o-", label="eigenvalue limit")
ax.loglog(Ms, limits[0] * (Ms / Ms[0]) ** -2.0, ":", color="0.4", label="$M^{-2}$")
ax.set_xlabel("spot intervals M")
ax.set_ylabel("largest stable dt")
ax.legend()
plt.show()
Total running time of the script: (0 minutes 0.170 seconds)
