
Note
Go to the end to download the full example code or to run this example in your browser via JupyterLite.
Von Neumann stability analysis#
John von Neumann’s method, used at Los Alamos in the 1940s and published
in 1950, inserts a single Fourier mode \(V_j^n = g^n e^{ij\xi}\) into a
constant-coefficient scheme. The mode grows when its amplification factor
has \(|g(\xi)| > 1\), so stability means \(|g| \le 1\) for every
\(\xi\). For the theta-scheme in log-spot,
\(g = (1 + (1-\theta)z)/(1 - \theta z)\) with
\(z \approx -\sigma^2\Delta t/\Delta x^2 (1 - \cos\xi)\):
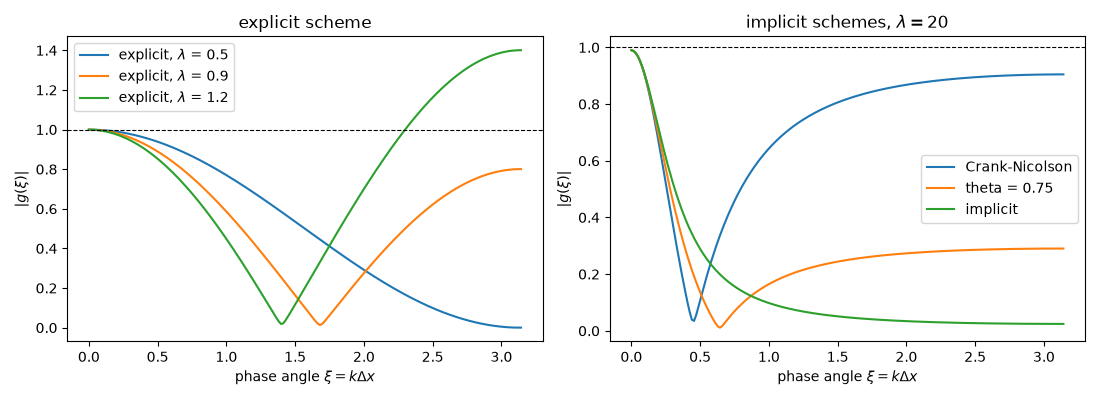
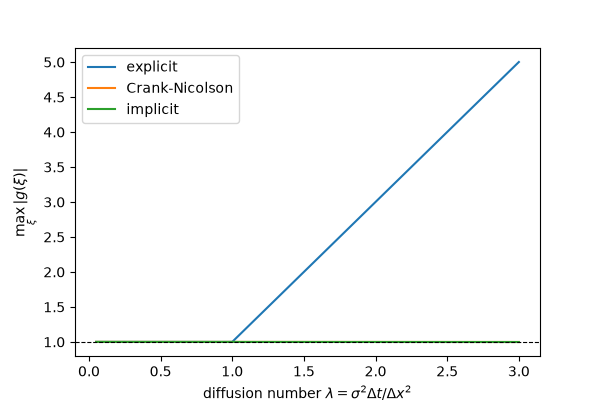
von_neumann_amplification() shows the
explicit scheme failing above a diffusion number of one, Crank-Nicolson
never growing but barely damping the highest modes, and the implicit
scheme damping them all.
import matplotlib.pyplot as plt
import numpy as np

from financialkit.pde_methods import von_neumann_amplification
from financialkit.pde_methods.visualizers import plot_amplification

sigma, r, dx = 0.2, 0.05, 0.02

fig, axes = plt.subplots(1, 2, figsize=(11, 4))
lams = [0.5, 0.9, 1.2]
res = [von_neumann_amplification(sigma, r, lam * dx**2 / sigma**2, dx, theta=0.0) for lam in lams]
plot_amplification(res, labels=[f"explicit, $\\lambda$ = {lam}" for lam in lams], ax=axes[0])
axes[0].set_title("explicit scheme")

big = 20 * dx**2 / sigma**2  # a diffusion number of 20
res = [von_neumann_amplification(sigma, r, big, dx, theta=t) for t in (0.5, 0.75, 1.0)]
plot_amplification(res, labels=["Crank-Nicolson", "theta = 0.75", "implicit"], ax=axes[1])
axes[1].set_title(r"implicit schemes, $\lambda = 20$")
fig.tight_layout()
plt.show()
The largest amplification against the diffusion number#
lam = np.linspace(0.05, 3.0, 60)
fig, ax = plt.subplots(figsize=(6, 4))
for theta, name in ((0.0, "explicit"), (0.5, "Crank-Nicolson"), (1.0, "implicit")):
    ax.plot(lam, [von_neumann_amplification(sigma, r, l * dx**2 / sigma**2, dx, theta=theta).max_modulus for l in lam], label=name)
ax.axhline(1.0, color="k", lw=0.8, ls="--")
ax.set_xlabel(r"diffusion number $\lambda = \sigma^2 \Delta t / \Delta x^2$")
ax.set_ylabel(r"$\max_\xi |g(\xi)|$")
ax.legend()
plt.show()
Total running time of the script: (0 minutes 0.117 seconds)
