
Note
Go to the end to download the full example code or to run this example in your browser via JupyterLite.
Christoffersen’s independence test#
Kupiec’s test counts exceptions but ignores when they happen. A VaR that is right on average but slow to react produces exceptions in bunches, exactly when a bank can least afford them. Christoffersen (1998) fitted a two-state Markov chain to the hit sequence and tested whether a hit is more likely the day after a hit, \(\pi_{11} > \pi_{01}\); adding Kupiec’s statistic gives the conditional-coverage test, \(LR_{cc} = LR_{uc} + LR_{ind} \sim \chi^2_2\).
import matplotlib.pyplot as plt
import numpy as np

from financialkit.risk import christoffersen_independence, christoffersen_test, kupiec_test, parametric_var, var_exceptions
from financialkit.risk.visualizers import plot_backtest
from financialkit.time_series import GARCH
A constant VaR on a GARCH market#
Returns follow a GARCH(1,1) process, simulated with
financialkit.time_series.GARCH. One VaR uses the unconditional
volatility, the other the GARCH conditional volatility. Both are
exceeded about as often as they should be, so Kupiec’s test is
satisfied, but the constant VaR’s exceptions arrive in the volatile
spells.
n = 2000
model = GARCH(omega=2e-6, alpha=0.20, beta=0.78)
path = model.simulate(n, rng=0)
r, sig2 = path.returns, path.variance
static = parametric_var(0.0, np.sqrt(model.unconditional_variance), 0.99)
dynamic = parametric_var(0.0, np.sqrt(sig2), 0.99)
for name, var in [("constant VaR", static), ("GARCH VaR", dynamic)]:
    hits = var_exceptions(r, var)
    uc, ind, cc = kupiec_test(hits), christoffersen_independence(hits), christoffersen_test(hits)
    print(f"{name:12s}: {uc.n_exceptions} hits; p(uc) = {uc.p_value:.3f}, p(ind) = {ind.p_value:.4f}, p(cc) = {cc.p_value:.4f}")

fig, axes = plt.subplots(2, 1, figsize=(8, 6), sharex=True)
plot_backtest(r, np.full(n, static), ax=axes[0])
axes[0].set_title("constant VaR: exceptions cluster")
plot_backtest(r, dynamic, ax=axes[1])
axes[1].set_title("conditional VaR: exceptions scattered")
fig.tight_layout()
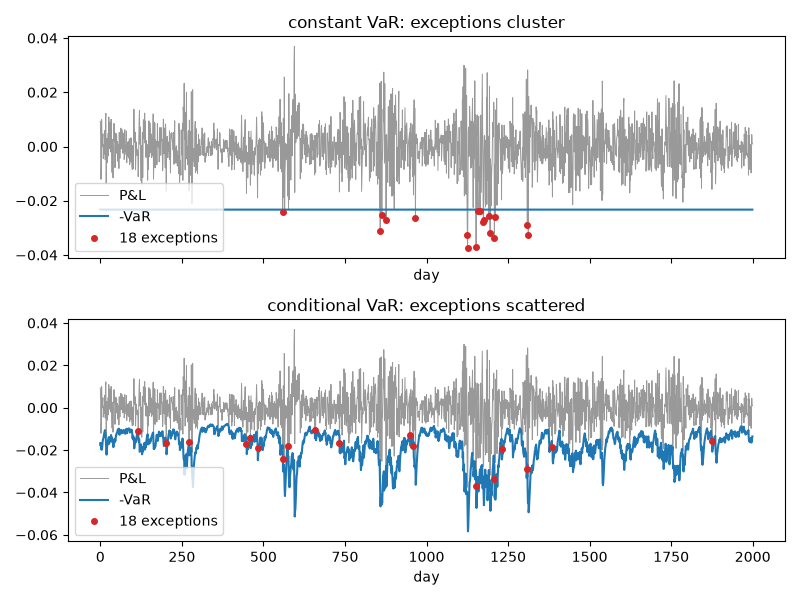
constant VaR: 18 hits; p(uc) = 0.648, p(ind) = 0.0093, p(cc) = 0.0305
GARCH VaR   : 18 hits; p(uc) = 0.648, p(ind) = 0.5674, p(cc) = 0.7648
How often each test notices#
On one path the evidence can go either way, so repeat the experiment. The independence test rejects the constant VaR on most paths, and the conditional VaR at about its 5% size. Kupiec also rejects the constant VaR fairly often: GARCH returns are fat-tailed, so a normal VaR with the right variance is exceeded too often on average.
paths = [model.simulate(n, rng=seed) for seed in range(1, 301)]
R = np.array([p.returns for p in paths])
S2 = np.array([p.variance for p in paths])
for name, V in [("constant VaR", np.full_like(R, static)), ("GARCH VaR", parametric_var(0.0, np.sqrt(S2), 0.99))]:
    H = var_exceptions(R, V)
    uc = np.mean([kupiec_test(h).reject() for h in H])
    ind = np.mean([christoffersen_independence(h).reject() for h in H])
    print(f"{name:12s}: Kupiec rejects {uc:.0%}, independence rejects {ind:.0%} of 300 paths")

plt.show()
constant VaR: Kupiec rejects 50%, independence rejects 69% of 300 paths
GARCH VaR   : Kupiec rejects 4%, independence rejects 1% of 300 paths
Total running time of the script: (0 minutes 0.868 seconds)
