
Note
Go to the end to download the full example code or to run this example in your browser via JupyterLite.
Fama-French three factors#
The CAPM fails on portfolios sorted by size and book-to-market: small stocks and value stocks earn more than their market betas justify. Eugene Fama and Kenneth French (1993) added two long-short factors built from the same sorts, SMB (small minus big) and HML (high minus low book-to-market),
\[r^e_{it} = \alpha_i + b_i\,MKT_t + s_i\,SMB_t + h_i\,HML_t + \varepsilon_{it},\]
and found that the alphas of 25 size-value portfolios nearly vanish. Here a synthetic market has stocks whose size and value characteristics drive hidden factor loadings.
import matplotlib.pyplot as plt
import numpy as np

from financialkit.asset_pricing import grs_test, long_short_factor, sort_portfolios, time_series_regression
from financialkit.asset_pricing.visualizers import plot_alphas

rng = np.random.default_rng(1993)
T, N = 360, 600
size = rng.standard_normal(N)  # log market cap, standardized
value = rng.standard_normal(N)  # book-to-market, standardized
loadings = np.column_stack([rng.uniform(0.8, 1.2, N), -0.6 * size + 0.2 * rng.standard_normal(N), 0.6 * value + 0.2 * rng.standard_normal(N)])
f_true = rng.multivariate_normal([0.006, 0.0025, 0.003], np.diag([0.045, 0.03, 0.03]) ** 2, T)
R = f_true @ loadings.T + 0.08 * rng.standard_normal((T, N))

mkt = R.mean(axis=1)
smb = long_short_factor(-size, R)
hml = long_short_factor(value, R)
print(f"mean monthly SMB {smb.mean():.4f}, HML {hml.mean():.4f}")
mean monthly SMB 0.0031, HML 0.0087
25 size-value portfolios#
size_q = np.digitize(size, np.quantile(size, [0.2, 0.4, 0.6, 0.8]))
ports = np.column_stack([sort_portfolios(np.where(size_q == q, value, np.nan), R, 5) for q in range(5)])

capm = time_series_regression(ports, mkt)
ff3 = time_series_regression(ports, np.column_stack([mkt, smb, hml]))
g1 = grs_test(ports, mkt)
g3 = grs_test(ports, np.column_stack([mkt, smb, hml]))
print(f"CAPM: GRS = {g1.statistic:.2f}, p = {g1.p_value:.3g}")
print(f"FF3:  GRS = {g3.statistic:.2f}, p = {g3.p_value:.3g}")

fig, ax = plt.subplots(figsize=(10, 4))
plot_alphas(capm, ax=ax, label="CAPM", offset=-0.2, width=0.4)
plot_alphas(ff3, ax=ax, label="Fama-French 3", offset=0.2, width=0.4)
ax.set_xlabel("portfolio (size quintile x value quintile)")
fig.tight_layout()

plt.show()
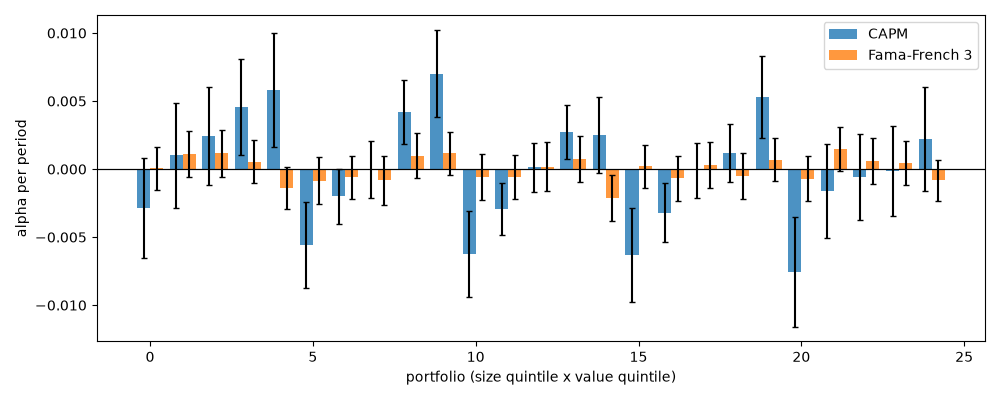
CAPM: GRS = 1.64, p = 0.0297
FF3:  GRS = 0.92, p = 0.577
Total running time of the script: (0 minutes 0.080 seconds)
