
Note
Go to the end to download the full example code or to run this example in your browser via JupyterLite.
Carhart’s momentum factor#
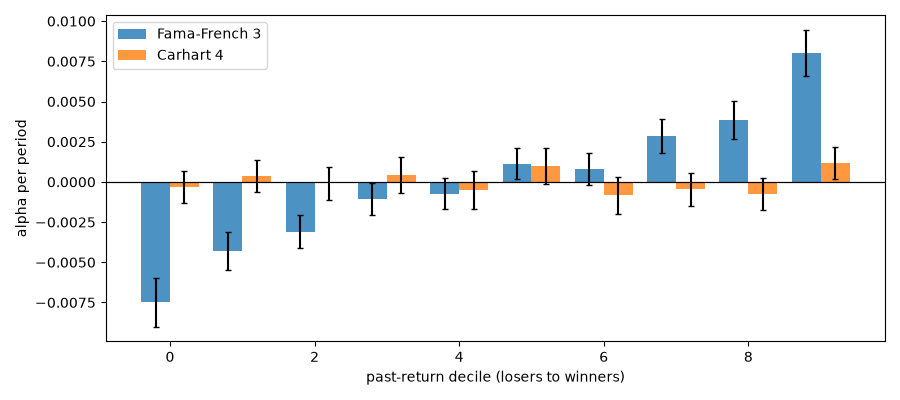
Jegadeesh and Titman (1993) found that stocks with the highest returns over the past year keep outperforming for months, which the Fama-French factors cannot explain. Mark Carhart (1997) added a fourth factor, UMD (up minus down), long last year’s winners and short its losers, skipping the most recent month. With it, most of the apparent persistence in mutual fund performance disappeared: winning funds had simply held winning stocks.
In this synthetic market each stock’s expected return drifts slowly, so past winners tend to keep winning.
import matplotlib.pyplot as plt
import numpy as np

from financialkit.asset_pricing import long_short_factor, momentum_signal, sort_portfolios, time_series_regression
from financialkit.asset_pricing.visualizers import plot_alphas

rng = np.random.default_rng(1997)
T, N, phi = 372, 500, 0.95
size, value = rng.standard_normal(N), rng.standard_normal(N)
loadings = np.column_stack([rng.uniform(0.8, 1.2, N), -0.6 * size, 0.6 * value])
f_true = rng.multivariate_normal([0.006, 0.0025, 0.003], np.diag([0.045, 0.03, 0.03]) ** 2, T)
drift = np.zeros((T, N))
for t in range(1, T):
    drift[t] = phi * drift[t - 1] + 0.012 * np.sqrt(1 - phi**2) * rng.standard_normal(N)
R = f_true @ loadings.T + drift + 0.06 * rng.standard_normal((T, N))

mom = momentum_signal(R, lookback=12, skip=1)
keep = slice(12, None)
mkt = R.mean(axis=1)[keep]
smb = long_short_factor(-size, R)[keep]
hml = long_short_factor(value, R)[keep]
umd = long_short_factor(mom, R)[keep]
print(f"mean monthly UMD: {umd.mean():.4f} (t = {umd.mean() / umd.std() * np.sqrt(umd.size):.1f})")
mean monthly UMD: 0.0102 (t = 11.9)
Momentum deciles under three and four factors#
deciles = sort_portfolios(mom, R, 10)[keep]
ff3 = time_series_regression(deciles, np.column_stack([mkt, smb, hml]))
c4 = time_series_regression(deciles, np.column_stack([mkt, smb, hml, umd]))
fig, ax = plt.subplots(figsize=(9, 4))
plot_alphas(ff3, ax=ax, label="Fama-French 3", offset=-0.2, width=0.4)
plot_alphas(c4, ax=ax, label="Carhart 4", offset=0.2, width=0.4)
ax.set_xlabel("past-return decile (losers to winners)")
fig.tight_layout()

plt.show()
Total running time of the script: (0 minutes 0.080 seconds)
