
Note
Go to the end to download the full example code or to run this example in your browser via JupyterLite.
Markowitz’s mean-variance frontier#
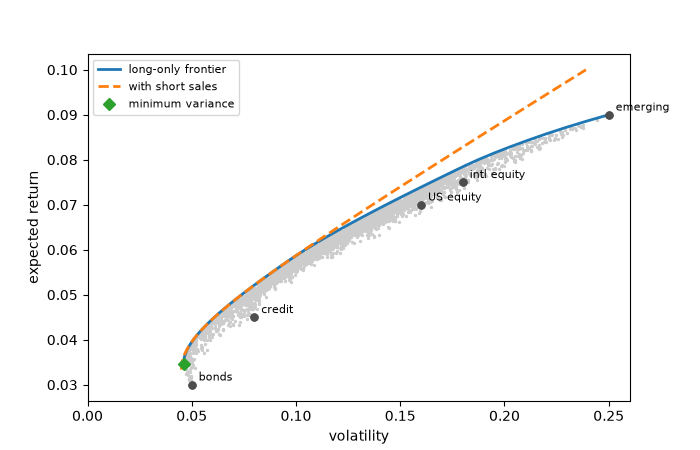
Harry Markowitz (1952) argued that an investor should look at a
portfolio’s expected return and its variance together, and hold only
portfolios with the least variance for their mean. Diversification then
has a precise meaning: combining imperfectly correlated assets moves the
frontier to the left of every asset on its own. With short sales the
frontier is a hyperbola; without them, every point is a quadratic
program, solved here with scipy.optimize.minimize().
import matplotlib.pyplot as plt
import numpy as np

from financialkit.portfolio import efficient_frontier, min_variance_portfolio
from financialkit.portfolio.visualizers import plot_frontier, plot_weights

names = ["bonds", "credit", "US equity", "intl equity", "emerging"]
mu = np.array([0.03, 0.045, 0.07, 0.075, 0.09])
vol = np.array([0.05, 0.08, 0.16, 0.18, 0.25])
corr = np.array(
    [
        [1.0, 0.6, -0.1, -0.1, 0.0],
        [0.6, 1.0, 0.3, 0.3, 0.4],
        [-0.1, 0.3, 1.0, 0.8, 0.7],
        [-0.1, 0.3, 0.8, 1.0, 0.75],
        [0.0, 0.4, 0.7, 0.75, 1.0],
    ]
)
cov = corr * np.outer(vol, vol)
Random portfolios fill the region the frontier bounds#
rng = np.random.default_rng(0)
W = rng.dirichlet(np.ones(5) * 0.5, 3000)
ax = plot_frontier(efficient_frontier(mu, cov, 40, long_only=True), labels=names)
plot_frontier(efficient_frontier(mu, cov, 40, max_return=0.1), ax=ax, ls="--", label="with short sales")
ax.scatter(np.sqrt(np.einsum("ij,jk,ik->i", W, cov, W)), W @ mu, s=2, color="0.8", zorder=0)
gmv = min_variance_portfolio(cov, mu, long_only=True)
ax.plot(gmv.volatility, gmv.expected_return, "D", color="C2", label="minimum variance")
ax.legend(fontsize=8)
print(f"minimum-variance portfolio: {gmv.volatility:.2%} volatility, below the safest asset's {vol.min():.0%}")
minimum-variance portfolio: 4.61% volatility, below the safest asset's 5%
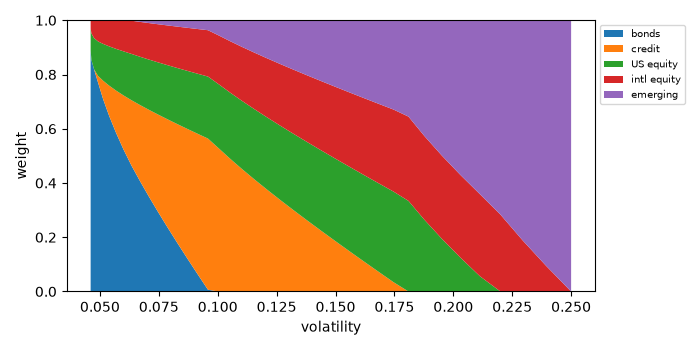
The composition along the long-only frontier#
The weights move smoothly from mostly bonds to all emerging markets. Note that the minimum-variance portfolio holds some equity: its negative correlation with bonds lowers risk.
fr = efficient_frontier(mu, cov, 40, long_only=True)
ax = plot_weights(fr.weights, labels=names, x=fr.volatilities)
ax.set_xlabel("volatility")
plt.tight_layout()
plt.show()
Total running time of the script: (0 minutes 0.101 seconds)
