
Note
Go to the end to download the full example code or to run this example in your browser via JupyterLite.
Tobin separation and the tangency portfolio#
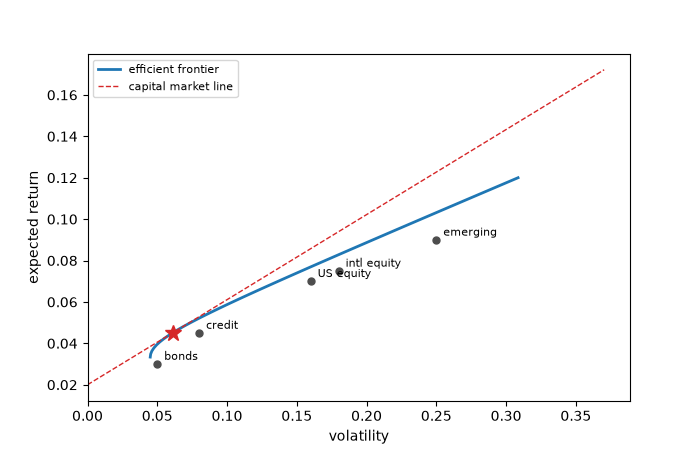
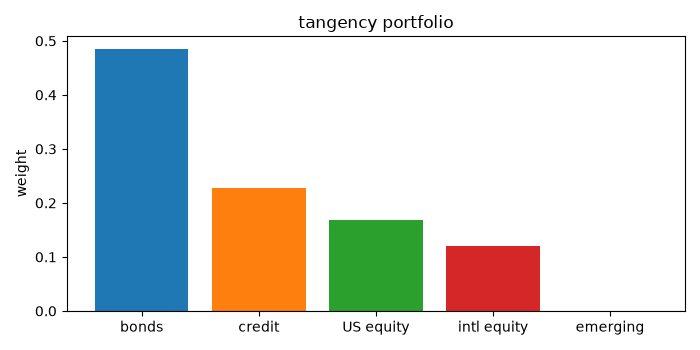
James Tobin (1958) added a riskless asset to Markowitz’s problem. Combinations of cash and any risky portfolio lie on a straight line, and the steepest such line touches the frontier at the tangency portfolio. Every mean-variance investor holds that same mix of risky assets and differs only in how much cash goes with it: the risky choice separates from the attitude to risk. The line is the capital market line, and its slope is the highest attainable Sharpe ratio.
import matplotlib.pyplot as plt
import numpy as np

from financialkit.portfolio import efficient_frontier, tangency_portfolio, two_fund_allocation
from financialkit.portfolio.visualizers import plot_frontier, plot_weights

names = ["bonds", "credit", "US equity", "intl equity", "emerging"]
mu = np.array([0.03, 0.045, 0.07, 0.075, 0.09])
vol = np.array([0.05, 0.08, 0.16, 0.18, 0.25])
corr = np.array(
    [
        [1.0, 0.6, -0.1, -0.1, 0.0],
        [0.6, 1.0, 0.3, 0.3, 0.4],
        [-0.1, 0.3, 1.0, 0.8, 0.7],
        [-0.1, 0.3, 0.8, 1.0, 0.75],
        [0.0, 0.4, 0.7, 0.75, 1.0],
    ]
)
cov = corr * np.outer(vol, vol)
rf = 0.02
The capital market line#
t = tangency_portfolio(mu, cov, rf)
ax = plot_frontier(efficient_frontier(mu, cov, 60, max_return=0.12), labels=names, rf=rf)
print(f"tangency portfolio: mean {t.expected_return:.2%}, volatility {t.volatility:.2%}, Sharpe {t.sharpe_ratio(rf):.3f}")
tangency portfolio: mean 4.56%, volatility 6.22%, Sharpe 0.411
Three investors, one risky portfolio#
The optimal allocation \(\Sigma^{-1}(\mu - r_f)/\gamma\) scales with risk tolerance; normalized, it is the tangency portfolio every time.
fig, ax = plt.subplots(figsize=(7, 3.5))
for i, gamma in enumerate([4.0, 8.0, 16.0]):
    res = two_fund_allocation(mu, cov, rf, gamma)
    ax.bar(np.arange(6) + 0.27 * (i - 1), np.append(res.weights, 1 - res.weights.sum()), width=0.27, label=f"gamma = {gamma:g}")
    print(f"gamma = {gamma:g}: risky mix {np.round(res.weights / res.weights.sum(), 3)}, cash {1 - res.weights.sum():+.2f}")
ax.set_xticks(range(6), names + ["cash"])
ax.axhline(0, color="0.3", lw=0.8)
ax.set_ylabel("weight")
ax.legend()
fig.tight_layout()
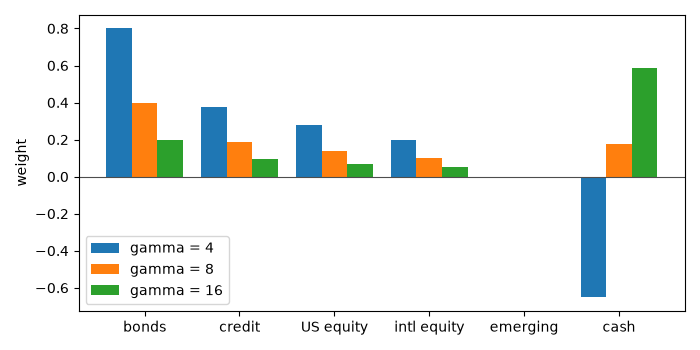
gamma = 4: risky mix [0.484 0.227 0.168 0.12  0.   ], cash -0.65
gamma = 8: risky mix [0.484 0.227 0.168 0.12  0.   ], cash +0.17
gamma = 16: risky mix [0.484 0.227 0.168 0.12  0.   ], cash +0.59
Total running time of the script: (0 minutes 0.089 seconds)
