
Note
Go to the end to download the full example code or to run this example in your browser via JupyterLite.
Choueifaty’s most-diversified portfolio#
Yves Choueifaty and Yves Coignard (2008) defined the diversification ratio of a long-only portfolio as its weighted average volatility over its actual volatility,
\[D(w) = \frac{w'\sigma}{\sqrt{w'\Sigma w}},\]
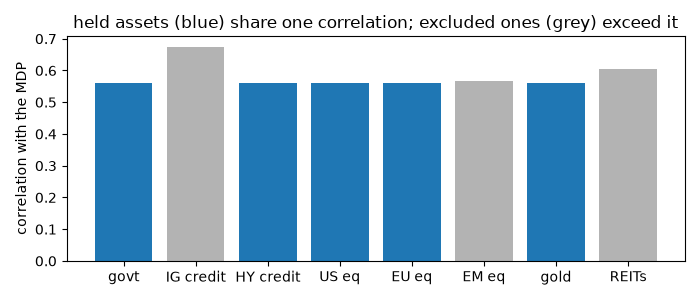
which equals one for a single asset and \(\sqrt{d}\) for \(d\) uncorrelated, equally risky assets held equally. The portfolio that maximizes it has a neat property: every asset it holds has the same correlation with it, and every asset it leaves out has a higher one.
import matplotlib.pyplot as plt
import numpy as np

from financialkit.portfolio import diversification_ratio, inverse_volatility_portfolio, min_variance_portfolio, most_diversified_portfolio
from financialkit.portfolio.visualizers import plot_weights

names = ["govt", "IG credit", "HY credit", "US eq", "EU eq", "EM eq", "gold", "REITs"]
vol = np.array([0.05, 0.06, 0.10, 0.16, 0.18, 0.22, 0.16, 0.20])
corr = np.array(
    [
        [1.0, 0.7, 0.1, -0.2, -0.2, -0.1, 0.2, 0.1],
        [0.7, 1.0, 0.5, 0.2, 0.2, 0.3, 0.2, 0.3],
        [0.1, 0.5, 1.0, 0.6, 0.6, 0.6, 0.1, 0.6],
        [-0.2, 0.2, 0.6, 1.0, 0.85, 0.75, 0.0, 0.7],
        [-0.2, 0.2, 0.6, 0.85, 1.0, 0.8, 0.05, 0.65],
        [-0.1, 0.3, 0.6, 0.75, 0.8, 1.0, 0.15, 0.6],
        [0.2, 0.2, 0.1, 0.0, 0.05, 0.15, 1.0, 0.1],
        [0.1, 0.3, 0.6, 0.7, 0.65, 0.6, 0.1, 1.0],
    ]
)
cov = corr * np.outer(vol, vol)
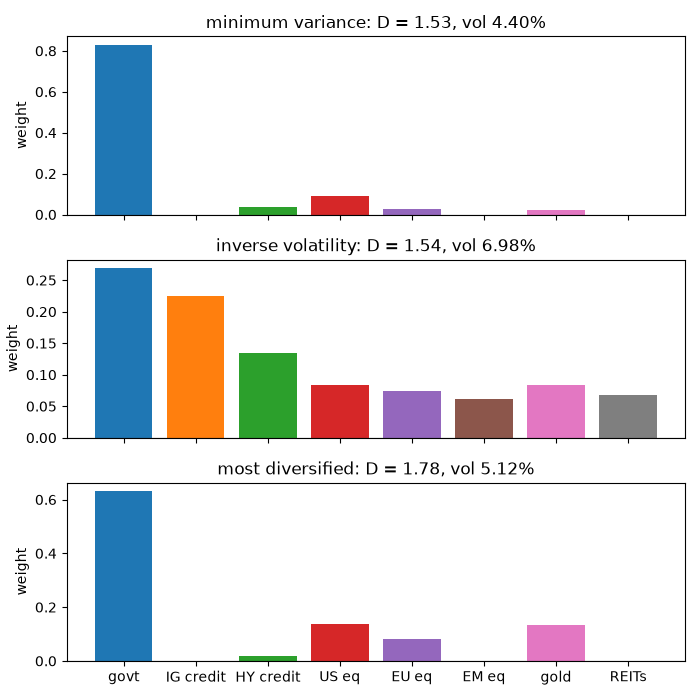
Three risk-based portfolios#
ports = {
    "minimum variance": min_variance_portfolio(cov, long_only=True),
    "inverse volatility": inverse_volatility_portfolio(cov),
    "most diversified": most_diversified_portfolio(cov),
}
fig, axes = plt.subplots(3, 1, figsize=(7, 7), sharex=True)
for ax, (label, p) in zip(axes, ports.items(), strict=True):
    plot_weights(p.weights, names, ax=ax).set_title(f"{label}: D = {diversification_ratio(p.weights, cov):.2f}, vol {p.volatility:.2%}")
fig.tight_layout()
The core property#
mdp = ports["most diversified"]
rho = (cov @ mdp.weights) / (vol * mdp.volatility)
fig, ax = plt.subplots(figsize=(7, 3))
ax.bar(names, rho, color=["C0" if w > 1e-6 else "0.7" for w in mdp.weights])
ax.set_ylabel("correlation with the MDP")
ax.set_title("held assets (blue) share one correlation; excluded ones (grey) exceed it")
fig.tight_layout()
plt.show()
Total running time of the script: (0 minutes 0.123 seconds)
