
Note
Go to the end to download the full example code or to run this example in your browser via JupyterLite.
Maillard-Roncalli-Teiletche risk parity#
An equally weighted stock-bond portfolio takes nearly all its risk from the stocks. Sébastien Maillard, Thierry Roncalli and Jérôme Teiletche (2010) studied the equal risk contribution portfolio, in which each asset’s Euler contribution \(w_i(\Sigma w)_i/\sigma_p\) to the portfolio volatility is the same. It always exists and is unique, and its volatility lies between the minimum-variance and 1/N portfolios’. It is computed here from Spinu’s convex reformulation.
import matplotlib.pyplot as plt
import numpy as np

from financialkit.portfolio import equal_weight, min_variance_portfolio, risk_parity
from financialkit.risk import euler_allocation

names = ["govt bonds", "credit", "equities", "commodities"]
vol = np.array([0.05, 0.08, 0.17, 0.22])
corr = np.array([[1.0, 0.5, -0.2, 0.0], [0.5, 1.0, 0.4, 0.2], [-0.2, 0.4, 1.0, 0.4], [0.0, 0.2, 0.4, 1.0]])
cov = corr * np.outer(vol, vol)
Weights and risk contributions#
ports = {
    "1/N": equal_weight(4),
    "minimum variance": min_variance_portfolio(cov, long_only=True).weights,
    "risk parity": risk_parity(cov).weights,
}
fig, axes = plt.subplots(1, 2, figsize=(10, 3.8))
bottom_w, bottom_r = np.zeros(3), np.zeros(3)
for i, name in enumerate(names):
    w = np.array([p[i] for p in ports.values()])
    rc = np.array([euler_allocation(p, cov, measure="volatility").shares[i] for p in ports.values()])
    axes[0].bar(list(ports), w, bottom=bottom_w, label=name)
    axes[1].bar(list(ports), rc, bottom=bottom_r, label=name)
    bottom_w += w
    bottom_r += rc
axes[0].set_title("capital")
axes[1].set_title("risk contribution")
axes[1].legend(fontsize=8, loc="upper left", bbox_to_anchor=(1, 1))
fig.tight_layout()
for label, w in ports.items():
    print(f"{label:>16}: vol {np.sqrt(w @ cov @ w):.2%}")
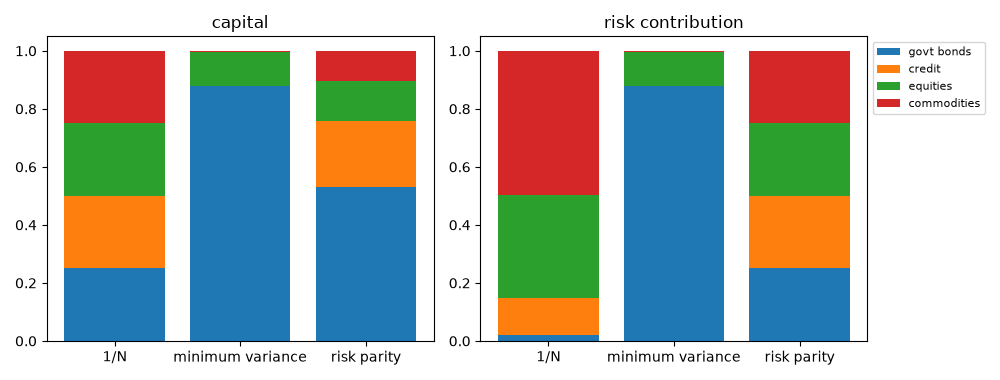
             1/N: vol 9.17%
minimum variance: vol 4.46%
     risk parity: vol 5.73%
Risk budgets#
Unequal budgets give each asset a chosen share of the risk; the contributions match them exactly.
weights: [0.637 0.158 0.156 0.049] risk shares: [0.4 0.2 0.3 0.1]
Risk parity and correlation#
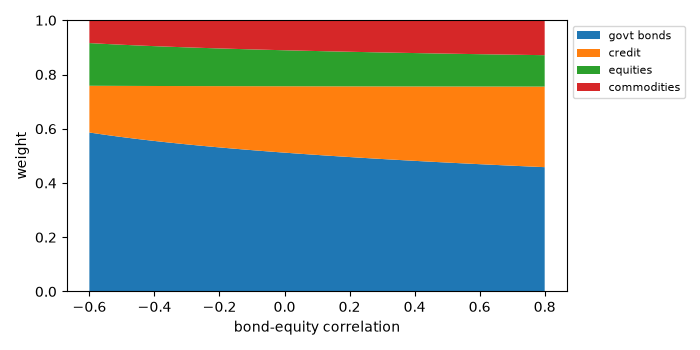
With two assets, ERC is inverse volatility whatever the correlation; with more, correlations matter. Here the equity-bond correlation is varied.
rhos = np.linspace(-0.6, 0.8, 30)
W = []
for r in rhos:
    c = corr.copy()
    c[0, 2] = c[2, 0] = r
    W.append(risk_parity(c * np.outer(vol, vol)).weights)
fig, ax = plt.subplots(figsize=(7, 3.5))
ax.stackplot(rhos, np.array(W).T, labels=names)
ax.set_xlabel("bond-equity correlation")
ax.set_ylabel("weight")
ax.set_ylim(0, 1)
ax.legend(fontsize=8, loc="upper left", bbox_to_anchor=(1, 1))
fig.tight_layout()
plt.show()
Total running time of the script: (0 minutes 0.097 seconds)
