
Note
Go to the end to download the full example code or to run this example in your browser via JupyterLite.
Ljung-Box portmanteau test#
Checking twenty autocorrelations one at a time finds a “significant” one by chance about two times in three. Box and Pierce (1970) pooled them into a single statistic, \(Q = n\sum_{k \le h}\hat\rho_k^2 \sim \chi^2_h\), and Greta Ljung and George Box (1978) fixed its poor small-sample behaviour by weighting each term,
It is the standard residual check of a fitted ARMA model and, applied to squared returns, a test for volatility clustering.
import matplotlib.pyplot as plt
import numpy as np
from scipy import stats

from financialkit.time_series import GARCH, box_pierce, ljung_box
Small-sample size: Box-Pierce versus Ljung-Box#
For 2,000 white-noise samples of length 50, the Ljung-Box statistic follows its \(\chi^2_{10}\) reference closely; Box-Pierce falls short of it and rejects too rarely.
rng = np.random.default_rng(1978)
n, h = 50, 10
qbp, qlb = np.empty(2000), np.empty(2000)
for i in range(2000):
    x = rng.standard_normal(n)
    qbp[i], qlb[i] = box_pierce(x, h).statistic, ljung_box(x, h).statistic

fig, ax = plt.subplots()
grid = np.linspace(0, 30, 300)
ax.hist([qbp, qlb], bins=40, density=True, label=["Box-Pierce", "Ljung-Box"], histtype="step", lw=1.5)
ax.plot(grid, stats.chi2.pdf(grid, h), "k", label=r"$\chi^2_{10}$")
ax.set_xlabel("Q")
ax.legend()
crit = stats.chi2.ppf(0.95, h)
print(f"rejection rate at 5%: Box-Pierce {np.mean(qbp > crit):.3f}, Ljung-Box {np.mean(qlb > crit):.3f}")
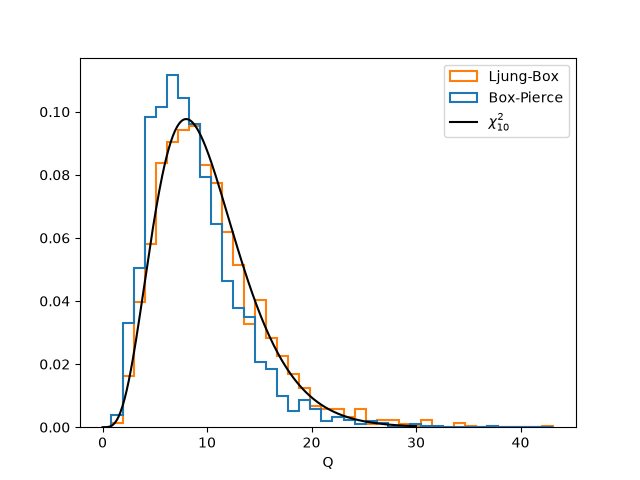
rejection rate at 5%: Box-Pierce 0.033, Ljung-Box 0.064
Returns versus squared returns#
GARCH returns are uncorrelated, so Ljung-Box finds nothing in them, but their squares are strongly autocorrelated: the signature of volatility clustering. (The \(\chi^2\) reference assumes independent data, so on heteroskedastic returns the test rejects somewhat more often than its nominal size.)
returns          Q(20) =     21.2, p = 0.387
squared returns  Q(20) =    654.3, p = 1.03e-125
Total running time of the script: (0 minutes 0.217 seconds)
