Note
Go to the end to download the full example code or to run this example in your browser via JupyterLite.
Random graphs and the connectivity threshold (Erdős and Rényi 1959)#
If each pair of n peers is linked independently with probability p, when is
the whole network connected? Erdős and Rényi found a sharp threshold at
p = ln n / n: a little below it there are almost surely isolated peers,
a little above it the graph is almost surely connected. Each peer then needs
only about ln n random links, which is why Bitcoin’s few random outbound
connections per node suffice to hold the network together.
What to look for#
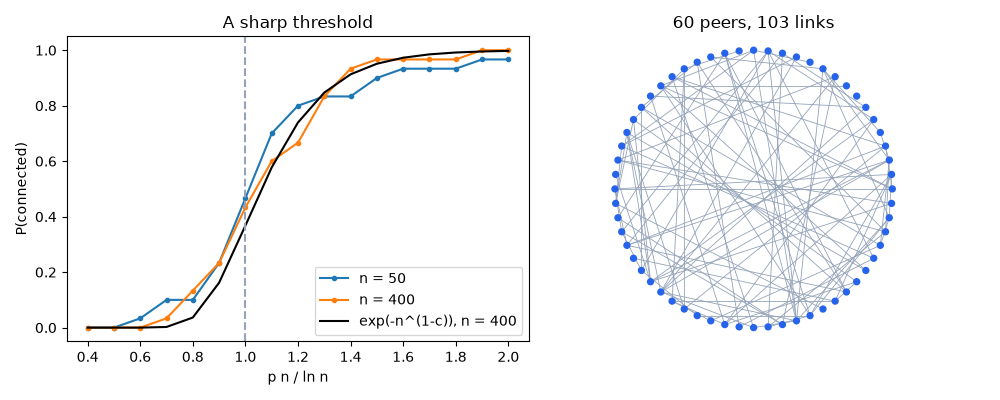
The probability of being connected jumps from near 0 to near 1 over a narrow
range of p n / ln n around 1. Erdős and Rényi also gave the shape of the
jump: with p = c ln n / n, the probability tends to exp(-n**(1 - c)),
about 1/e exactly at the threshold. Just below the threshold, what keeps
the graph disconnected is almost always a single isolated peer.
The history behind this experiment: Breakthroughs in Peer-to-Peer Networking. See Exercises: networking for a worked solution to the exercise.
Sweep p around ln n / n#
import math

import matplotlib.pyplot as plt
import numpy as np

import blockchainkit as bk
import blockchainkit.network.visualizers

scales = np.linspace(0.4, 2.0, 17)
curves = {}
for n in (50, 400):
    curves[n] = [
        np.mean(
            [
                bk.network.erdos_renyi(n, c * math.log(n) / n, seed=s).is_connected()
                for s in range(30)
            ]
        )
        for c in scales
    ]
assert curves[400][0] == 0 and curves[400][-1] == 1
limit = np.exp(-(400.0 ** (1 - scales)))  # Erdős-Rényi's limit law for n = 400.
assert np.max(np.abs(np.array(curves[400]) - limit)) < 0.25
What disconnects the graph?#
Below the threshold, the second-largest component is usually one peer.
n = 400
small = []
for s in range(30):
    g = bk.network.erdos_renyi(n, 0.8 * math.log(n) / n, seed=s)
    if not g.is_connected():
        small.append(len(g.components()[1]))
print("size of the second-largest component:", sorted(small))
assert np.mean([size == 1 for size in small]) > 0.8

fig, (left, right) = plt.subplots(1, 2, figsize=(10, 4))
for n, curve in curves.items():
    left.plot(scales, curve, marker="o", markersize=3, label=f"n = {n}")
left.plot(scales, limit, color="black", label="exp(-n^(1-c)), n = 400")
left.axvline(1, color="#94a3b8", linestyle="--")
left.set(xlabel="p n / ln n", ylabel="P(connected)", title="A sharp threshold")
left.legend()
bk.network.visualizers.plot_graph(bk.network.erdos_renyi(60, 0.06, seed=2), ax=right)
fig.tight_layout()
size of the second-largest component: [1, 1, 1, 1, 1, 1, 1, 1, 1, 1, 1, 1, 1, 1, 1, 1, 1, 1, 1, 1, 1, 1, 1, 1, 1, 2]
Exercise#
The expected number of isolated peers is n (1 - p)**(n - 1), close to
n exp(-p n). Evaluate it at p = c ln n / n and explain why c = 1
is the threshold. If the number of isolated peers is roughly Poisson,
where does the limit law exp(-n**(1 - c)) come from?
Total running time of the script: (0 minutes 6.120 seconds)
