
Note
Go to the end to download the full example code or to run this example in your browser via JupyterLite.
VPIN: flow toxicity in volume time#
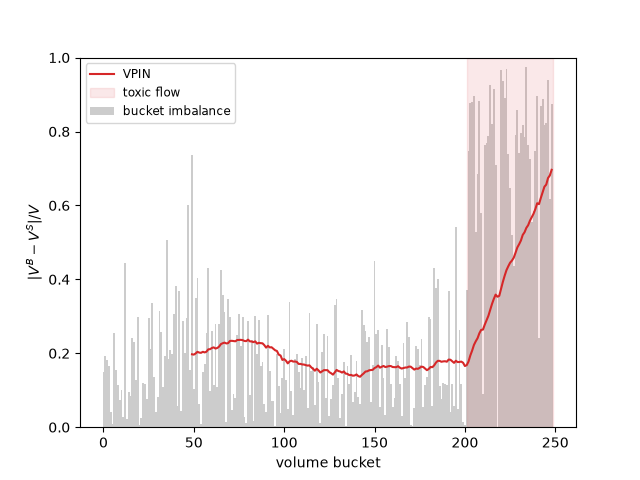
High-frequency markets have too many trades and too few days for the PIN likelihood. Easley, López de Prado and O’Hara (2012) measured order imbalance in volume time instead: cut the trading record into buckets of equal volume, split each one-minute bar’s volume into buys and sells by bulk volume classification, \(V^B = V\Phi(\Delta P/\sigma_{\Delta P})\), and average \(|V^B - V^S|/V\) over the last 50 buckets. Their VPIN rose for hours before the flash crash of 6 May 2010.
import matplotlib.pyplot as plt
import numpy as np

from financialkit.market_microstructure import vpin
from financialkit.market_microstructure.visualizers import plot_vpin

rng = np.random.default_rng(12)
A day with a toxic episode#
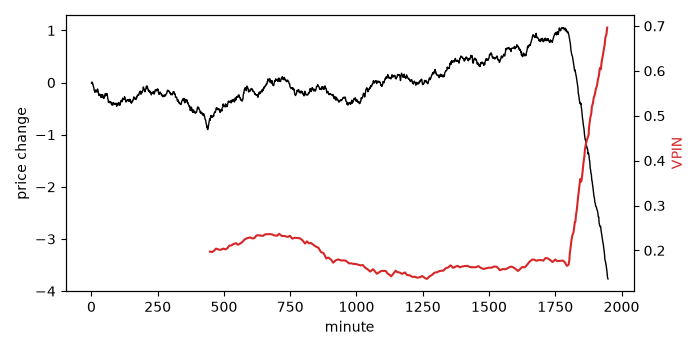
Five days of one-minute bars. On the last afternoon informed sellers arrive: volume triples and prices drift down.
n = 5 * 390
toxic = np.zeros(n, dtype=bool)
toxic[-150:] = True
volume = rng.gamma(4.0, 250.0, n) * np.where(toxic, 3.0, 1.0)
dp = 0.02 * rng.standard_normal(n) - np.where(toxic, 0.03, 0.0)
bucket = volume.sum() / 250  # about fifty buckets a day
res = vpin(dp, volume, bucket_volume=bucket, window=50, sigma=0.02)

ax = plot_vpin(res)
start = np.searchsorted(res.bucket_end, np.argmax(toxic))
ax.axvspan(start, res.vpin.size, color="C3", alpha=0.1, label="toxic flow")
ax.legend(loc="upper left", fontsize="small")
print(f"VPIN before the episode {np.nanmean(res.vpin[50:start]):.3f}, at the end {res.vpin[-1]:.3f}")
VPIN before the episode 0.181, at the end 0.696
Price and VPIN in clock time#
fig, ax = plt.subplots(figsize=(7, 3.5))
ax.plot(np.cumsum(dp), color="k", lw=1)
ax.set_xlabel("minute")
ax.set_ylabel("price change")
ax2 = ax.twinx()
ax2.plot(res.bucket_end, res.vpin, color="C3")
ax2.set_ylabel("VPIN", color="C3")
fig.tight_layout()

plt.show()
Total running time of the script: (0 minutes 0.099 seconds)
