
Note
Go to the end to download the full example code or to run this example in your browser via JupyterLite.
Möbius transformations map circles to circles#
August Ferdinand Möbius’s 1855 theory of Kreisverwandtschaft (“circle relationship”) studied the maps \(w = (az + b)/(cz + d)\), \(ad - bc \ne 0\). Every one of them sends circles and lines to circles and lines, where a line is a circle through \(\infty\). This script maps a family of circles and checks that each image is again a circle by fitting one to it.
import matplotlib.pyplot as plt
import numpy as np

from mathematicskit.complex_analysis import circle_contour, mobius_transform

a, b, c, d = 1.0, -0.5j, 0.6, 1.0 + 0.3j


def fit_circle(points):
    """Least-squares circle x^2 + y^2 + Dx + Ey + F = 0; returns center, radius, max residual."""
    x, y = points.real, points.imag
    A = np.column_stack([x, y, np.ones_like(x)])
    D, E, F = np.linalg.lstsq(A, -(x**2 + y**2), rcond=None)[0]
    center = complex(-D / 2, -E / 2)
    radius = np.sqrt(abs(center) ** 2 - F)
    return center, radius, np.max(np.abs(np.abs(points - center) - radius))
Circles in the z-plane and their images#
fig, (ax0, ax1) = plt.subplots(1, 2, figsize=(11, 5))
for k, (center, radius) in enumerate([(0.0, 0.5), (0.5 + 0.5j, 0.3), (-0.6, 0.4), (0.2 - 0.6j, 0.25)]):
    z = circle_contour(center, radius).points(400)
    w = mobius_transform(z, a, b, c, d)
    color = f"C{k}"
    ax0.plot(z.real, z.imag, color)
    ax1.plot(w.real, w.imag, color)
    w_center, w_radius, residual = fit_circle(w)
    print(f"circle {k}: image center {w_center:.4f}, radius {w_radius:.4f}, max deviation {residual:.1e}")
for ax, title in ((ax0, "z-plane"), (ax1, "w = (az + b)/(cz + d)")):
    ax.set_aspect("equal")
    ax.set_title(title)
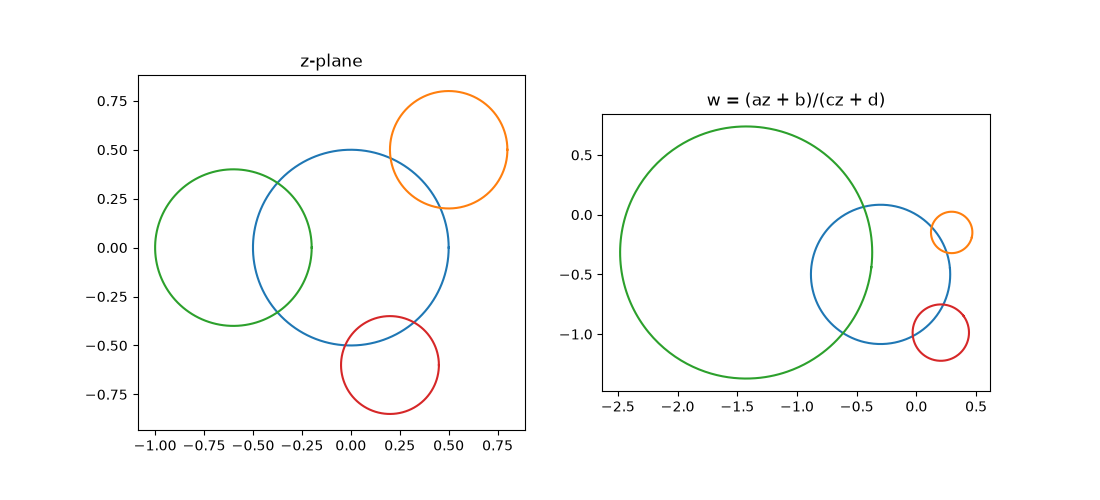
circle 0: image center -0.3000-0.5000j, radius 0.5831, max deviation 8.9e-16
circle 1: image center 0.2954-0.1487j, radius 0.1734, max deviation 4.7e-16
circle 2: image center -1.4253-0.3167j, radius 1.0554, max deviation 1.1e-15
circle 3: image center 0.2044-0.9875j, radius 0.2360, max deviation 2.1e-15
A circle through the pole -d/c becomes a line#
pole = -d / c
theta = np.linspace(0.0, 2.0 * np.pi, 401)[1:-1]  # theta = 0 is the pole itself
z = pole + 0.5 * (1.0 - np.exp(1j * theta))
w = mobius_transform(z, a, b, c, d)
p, q = w[100], w[300]  # two finite image points fix the line
distance = np.abs(((w - p) * np.conj(q - p)).imag) / abs(q - p)
print(f"max distance of the images from the line through two of them: {np.max(distance / np.maximum(1.0, np.abs(w))):.1e} (relative)")

plt.show()
max distance of the images from the line through two of them: 1.8e-14 (relative)
Total running time of the script: (0 minutes 0.117 seconds)
