
Note
Go to the end to download the full example code or to run this example in your browser via JupyterLite.
Cauchy’s integral formula: boundary values determine f and every derivative#
For \(f\) holomorphic inside a contour \(\gamma\),
\[f^{(n)}(z_0) = \frac{n!}{2\pi i}\oint_\gamma \frac{f(z)}{(z - z_0)^{n+1}}\,dz.\]
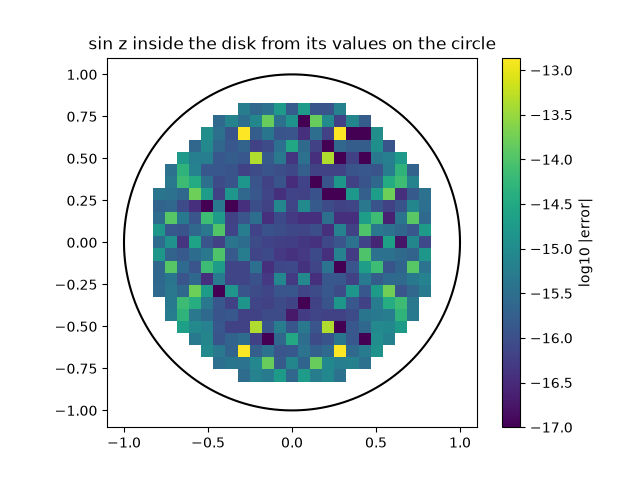
Sampling \(f\) only on the unit circle recovers \(e^{z}\) and its derivatives, and \(\sin z\) everywhere inside the disk.
import math

import matplotlib.pyplot as plt
import numpy as np

from mathematicskit.complex_analysis import cauchy_integral_formula, circle_contour, complex_grid

circle = circle_contour(0.0, 1.0)
Derivatives of e^z at z0 from boundary values alone#
n=0: formula = 1.322951502110+0.268175545969j, error vs e^z0 = 2.3e-16
n=1: formula = 1.322951502110+0.268175545969j, error vs e^z0 = 2.3e-16
n=2: formula = 1.322951502110+0.268175545969j, error vs e^z0 = 8.0e-16
n=3: formula = 1.322951502110+0.268175545969j, error vs e^z0 = 3.9e-15
n=4: formula = 1.322951502110+0.268175545969j, error vs e^z0 = 4.0e-14
Reconstructing sin z inside the disk#
z = complex_grid((-0.9, 0.9), (-0.9, 0.9), 25)
inside = np.abs(z) < 0.9
reconstructed = np.full(z.shape, np.nan, dtype=complex)
reconstructed[inside] = [cauchy_integral_formula(np.sin, circle, p) for p in z[inside]]
error = np.abs(reconstructed - np.sin(z))

fig, ax = plt.subplots()
image = ax.imshow(np.log10(error + 1e-17), origin="lower", extent=(-0.9, 0.9, -0.9, 0.9))
theta = np.linspace(0, 2 * math.pi, 200)
ax.plot(np.cos(theta), np.sin(theta), "k")
fig.colorbar(image, ax=ax, label="log10 |error|")
ax.set_title("sin z inside the disk from its values on the circle")
ax.set_aspect("equal")
Total running time of the script: (0 minutes 0.414 seconds)
