
Note
Go to the end to download the full example code or to run this example in your browser via JupyterLite.
The Casorati-Weierstrass theorem: near an essential singularity f comes close to every value#
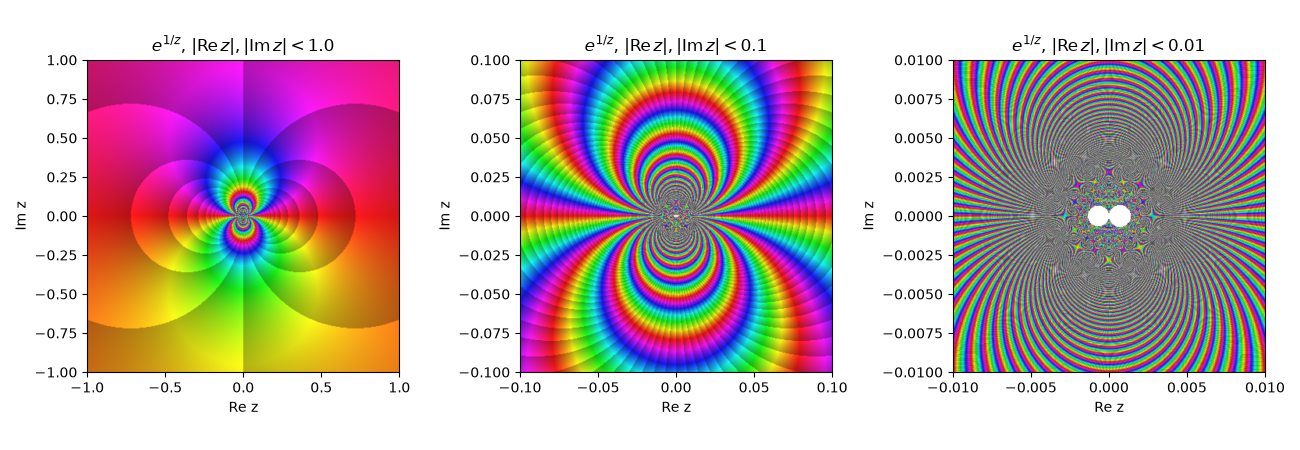
An isolated singularity is removable, a pole, or essential, depending on whether the Laurent series has no negative powers, finitely many, or infinitely many. Casorati and Weierstrass showed that near an essential singularity the values of \(f\) are dense in the plane. For \(e^{1/z}\) at 0 we find a point within \(\delta = 10^{-3}\) of 0 where \(f\) hits an arbitrary target \(w\), and the phase portrait shows every color packed into every neighbourhood of 0.
import matplotlib.pyplot as plt
import numpy as np

from mathematicskit.complex_analysis import domain_coloring, laurent_coefficients
from mathematicskit.complex_analysis.visualizers import plot_domain_coloring

f = lambda z: np.exp(1 / z)
Infinitely many negative powers#
series = laurent_coefficients(f, 0.0, 1.0, 6)
print("a_{-k} for k = 0..6:", np.round([series.coefficient(-k).real for k in range(7)], 6), "(= 1/k!)")
a_{-k} for k = 0..6: [1. 1. 0.5 0.166667 0.041667 0.008333 0.001389] (= 1/k!)
Hitting any target value arbitrarily close to 0#
\(e^{1/z} = w\) has the solutions \(z = 1/(\log w + 2\pi i n)\); large \(n\) makes \(|z|\) small.
target w = 5.0: z = 1.57e-06-9.89e-04j, |z| = 9.9e-04 < 0.001, f(z) = 5.000000-0.000000j
target w = (-2+1j): z = 7.82e-07-9.86e-04j, |z| = 9.9e-04 < 0.001, f(z) = -2.000000+1.000000j
target w = 0.0001j: z = -8.97e-06-9.87e-04j, |z| = 9.9e-04 < 0.001, f(z) = -0.000000+0.000100j
Zooming in on the singularity#
fig, axes = plt.subplots(1, 3, figsize=(13, 4.5))
for ax, half_width in zip(axes, (1.0, 0.1, 0.01), strict=False):
    result = domain_coloring(f, (-half_width, half_width), (-half_width, half_width), resolution=400)
    plot_domain_coloring(result, ax=ax, title=rf"$e^{{1/z}}$, $|{{\rm Re}}\,z|, |{{\rm Im}}\,z| < {half_width}$")
fig.tight_layout()
Total running time of the script: (0 minutes 0.480 seconds)
