
Note
Go to the end to download the full example code or to run this example in your browser via JupyterLite.
Inside the Yield Book: yield to maturity#
Sidney Homer and Martin Leibowitz’s Inside the Yield Book (1972) taught a generation of bond traders to think in yield to maturity: the single rate that discounts a bond’s cash flows to its price. The script inverts prices for yields, shows a bond pulled to par as it ages at a constant yield, and separates the dirty price, which drops by a coupon on each payment date, from the quoted clean price.
import matplotlib.pyplot as plt
import numpy as np

from financialkit.fixed_income import bond_cash_flows, bond_price, clean_price, yield_to_maturity
Price to yield and back#
cf = bond_cash_flows(100.0, 0.06, 10.0, freq=2)
for price in (90.0, 100.0, 110.0):
    y = yield_to_maturity(price, cf, compounding=2)
    print(f"price {price:6.2f} -> yield {100 * y:.4f}% (semiannual) -> price {bond_price(100.0, 0.06, 10.0, y, compounding=2):.6f}")
price  90.00 -> yield 7.4351% (semiannual) -> price 90.000000
price 100.00 -> yield 6.0000% (semiannual) -> price 100.000000
price 110.00 -> yield 4.7332% (semiannual) -> price 110.000000
Pull to par#
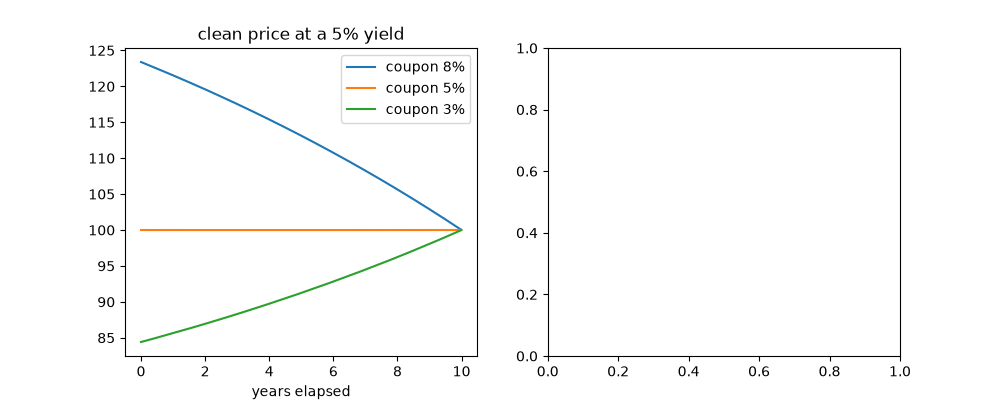
At an unchanged yield, a premium bond falls and a discount bond rises toward 100 as maturity approaches. Plotting the clean price removes the coupon sawtooth.
remaining = np.linspace(10.0, 0.01, 400)
fig, axes = plt.subplots(1, 2, figsize=(10, 4))
for coupon, y in ((0.08, 0.05), (0.05, 0.05), (0.03, 0.05)):
    axes[0].plot(10 - remaining, [clean_price(100.0, coupon, T, y, compounding=2) for T in remaining], label=f"coupon {100 * coupon:.0f}%")
axes[0].set_title("clean price at a 5% yield")
axes[0].set_xlabel("years elapsed")
axes[0].legend()
<matplotlib.legend.Legend object at 0x116e552b0>
Dirty versus clean#
remaining = np.linspace(3.0, 0.01, 600)
axes[1].plot(3 - remaining, [bond_price(100.0, 0.08, T, 0.05, compounding=2) for T in remaining], label="dirty")
axes[1].plot(3 - remaining, [clean_price(100.0, 0.08, T, 0.05, compounding=2) for T in remaining], label="clean")
axes[1].set_title("8% bond, last three years")
axes[1].set_xlabel("years elapsed")
axes[1].legend()
plt.show()
Total running time of the script: (0 minutes 0.478 seconds)
