
Note
Go to the end to download the full example code or to run this example in your browser via JupyterLite.
Redington immunization#
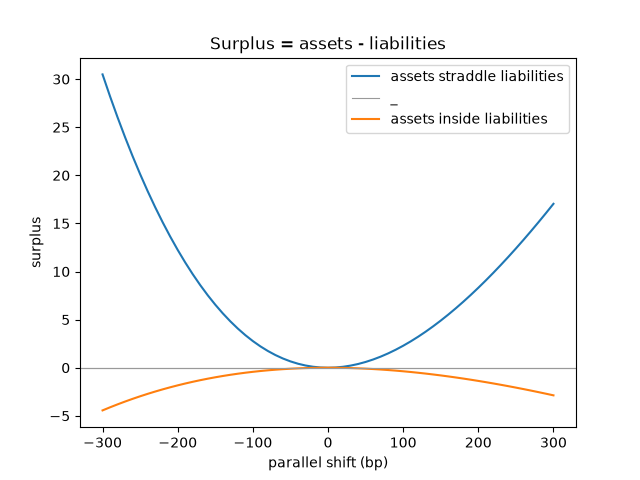
Frank Redington (1952), an actuary, asked how a life office could hold assets so that a change in interest rates leaves its surplus unharmed. His answer has three conditions: match the present values, match the durations, and make the assets more convex than the liabilities. Then the surplus has a local minimum at today’s rates. Assets that straddle the liabilities satisfy the third condition. Assets bunched inside them do not.
import matplotlib.pyplot as plt
import numpy as np

from financialkit.fixed_income import CashFlows, bond_cash_flows, redington_immunize
from financialkit.fixed_income.visualizers import plot_surplus

curve = 0.04
liabilities = CashFlows([3.0, 6.0, 9.0, 12.0], [250.0, 250.0, 250.0, 250.0])

straddle = redington_immunize(liabilities, [bond_cash_flows(1.0, 0.0, 1.0), bond_cash_flows(1.0, 0.0, 20.0)], curve)
inside = redington_immunize(liabilities, [bond_cash_flows(1.0, 0.0, 6.5), bond_cash_flows(1.0, 0.0, 8.0)], curve)

for name, res in (("1y/20y zeros", straddle), ("6.5y/8y zeros", inside)):
    print(
        f"{name}: holdings {res.holdings.round(1)}, PV {res.pv_assets:.2f} vs {res.pv_liabilities:.2f}, "
        f"D {res.duration_assets:.3f} vs {res.duration_liabilities:.3f}, "
        f"C {res.convexity_assets:.1f} vs {res.convexity_liabilities:.1f}, Redington: {res.redington_satisfied}"
    )
1y/20y zeros: holdings [530.2 529.9], PV 747.50 vs 747.50, D 7.052 vs 7.052, C 128.1 vs 60.8, Redington: True
6.5y/8y zeros: holdings [612.8 378.7], PV 747.50 vs 747.50, D 7.052 vs 7.052, C 50.3 vs 60.8, Redington: False
Surplus under parallel shifts#
fig, ax = plt.subplots()
shifts = np.linspace(-0.03, 0.03, 61)
plot_surplus(straddle, shifts, ax=ax)
plot_surplus(inside, shifts, ax=ax)
ax.legend(["assets straddle liabilities", "_", "assets inside liabilities"])
ax.set_title("Surplus = assets - liabilities")
plt.show()
Total running time of the script: (0 minutes 0.029 seconds)
