
Note
Go to the end to download the full example code or to run this example in your browser via JupyterLite.
Jamshidian: an exact bond option formula#
Farshid Jamshidian (1989) priced a European option on a zero-coupon bond in Vasicek’s model in closed form. Under the measure that uses the option-expiry bond as numeraire, the forward bond price \(P(0, S)/P(0, T)\) is a lognormal martingale, so
\[c = P(0, S) N(h) - K P(0, T) N(h - \sigma_P), \quad
h = \frac{1}{\sigma_P}\ln\frac{P(0, S)}{K P(0, T)} + \frac{\sigma_P}{2},\]
which is Black-76 on the forward bond. Only the total volatility \(\sigma_P\) depends on the model, and the same formula holds in Ho-Lee, Hull-White and G2++.
import matplotlib.pyplot as plt
import numpy as np

from financialkit.interest_rate_models import G2PlusPlusModel, HoLeeModel, HullWhiteModel, VasicekModel, path_discount_factors, zero_coupon_bond_option

vasicek = VasicekModel(0.03, 0.3, 0.05, 0.015)
T, S = 2.0, 7.0
Closed form against Monte Carlo#
K = np.linspace(0.70, 0.90, 9)
closed = zero_coupon_bond_option(vasicek, T, S, K, "call")
times, r = vasicek.simulate(T, 100, 20_000, rng=0)
D = path_discount_factors(times, r)[:, -1]
bond_at_T = vasicek.zero_coupon_bond(S, t=T, state=r[:, -1])
payoffs = D[:, None] * np.maximum(bond_at_T[:, None] - K[None, :], 0.0)
mc, se = payoffs.mean(axis=0), payoffs.std(axis=0) / np.sqrt(D.size)

fig, axes = plt.subplots(1, 2, figsize=(11, 4))
axes[0].plot(K, closed, "k-", label="Jamshidian closed form")
axes[0].errorbar(K, mc, yerr=1.96 * se, fmt="o", ms=3, capsize=2, label="Monte Carlo")
axes[0].set_xlabel("strike")
axes[0].set_ylabel(f"call on a {S:g}y bond, expiring in {T:g}y")
axes[0].legend()
print(f"largest |MC - closed form| / SE: {np.max(np.abs(mc - closed) / se):.2f}")
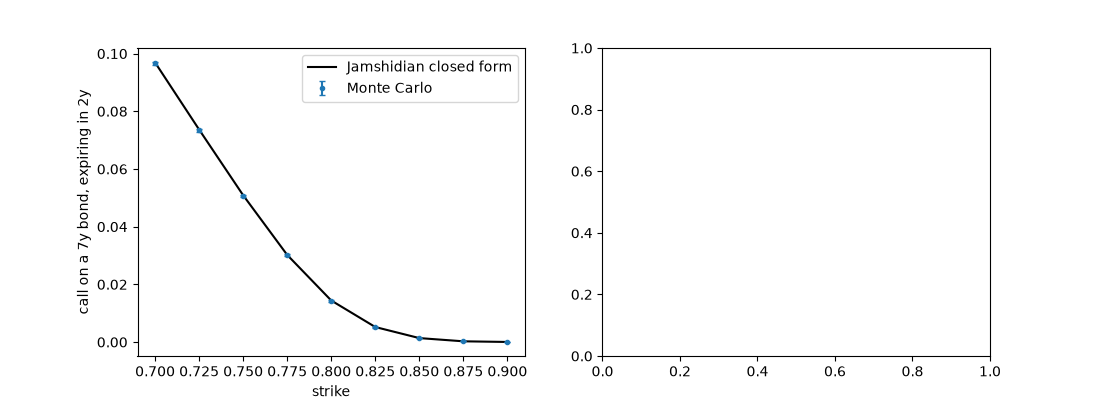
largest |MC - closed form| / SE: 1.14
One formula, four Gaussian models#
At the forward strike, the option value is driven by the total bond volatility each model implies.
curve = vasicek.curve()
models = {
    "Vasicek": vasicek,
    "Hull-White": HullWhiteModel(curve, 0.3, 0.015),
    "Ho-Lee": HoLeeModel(curve, 0.015),
    "G2++": G2PlusPlusModel(curve, 0.8, 0.012, 0.05, 0.008, -0.7),
}
expiry = np.linspace(0.25, 6.0, 40)
for name, m in models.items():
    Kf = m.zero_coupon_bond(S) / m.zero_coupon_bond(expiry)
    axes[1].plot(expiry, zero_coupon_bond_option(m, expiry, S, Kf), label=name)
axes[1].set_xlabel("option expiry T (years)")
axes[1].set_ylabel(f"at-the-money call on the {S:g}y bond")
axes[1].legend()
fig.tight_layout()

plt.show()
Total running time of the script: (0 minutes 0.109 seconds)
