
Note
Go to the end to download the full example code or to run this example in your browser via JupyterLite.
Delta hedging in discrete time#
Black and Scholes priced an option by showing that a dealer who sells it and holds \(\Delta\) shares, rebalancing continuously, carries no risk. Real hedges are rebalanced a finite number of times. The dealer’s terminal P&L then has mean zero but a spread that shrinks like \(1/\sqrt{n}\) in the number of rebalances (Boyle and Emanuel 1980), and the hedge works whatever the stock’s real-world drift.
import matplotlib.pyplot as plt
import numpy as np

from financialkit.options import delta_hedge
from financialkit.options.visualizers import plot_hedge_pnl
Hedging error against rebalancing frequency#
The stock drifts at 12% a year, far from the 5% risk-free rate, yet the hedged P&L is centred near zero.
S0, K, T, r, sigma = 100.0, 100.0, 0.5, 0.05, 0.2
counts = [4, 16, 64, 256]
stds = []
fig, axes = plt.subplots(1, 2, figsize=(11, 4))
for n in counts:
    res = delta_hedge(S0, K, T, r, sigma, n_rebalance=n, n_paths=4000, mu=0.12, rng=1)
    stds.append(res.pnl.std())
    print(f"n = {n:3d}: mean P&L {res.pnl.mean():+.3f}, std {res.pnl.std():.3f}  (premium {res.option_price:.3f})")
    if n in (16, 256):
        plot_hedge_pnl(res, ax=axes[0])
axes[0].set_title("terminal P&L of the hedged short call")

axes[1].loglog(counts, stds, "o-", label="std of hedged P&L")
axes[1].loglog(counts, stds[0] * np.sqrt(counts[0] / np.array(counts)), "k:", label=r"$\propto 1/\sqrt{n}$")
axes[1].set_xlabel("rebalances n")
axes[1].set_ylabel("std of P&L")
axes[1].legend()
fig.tight_layout()
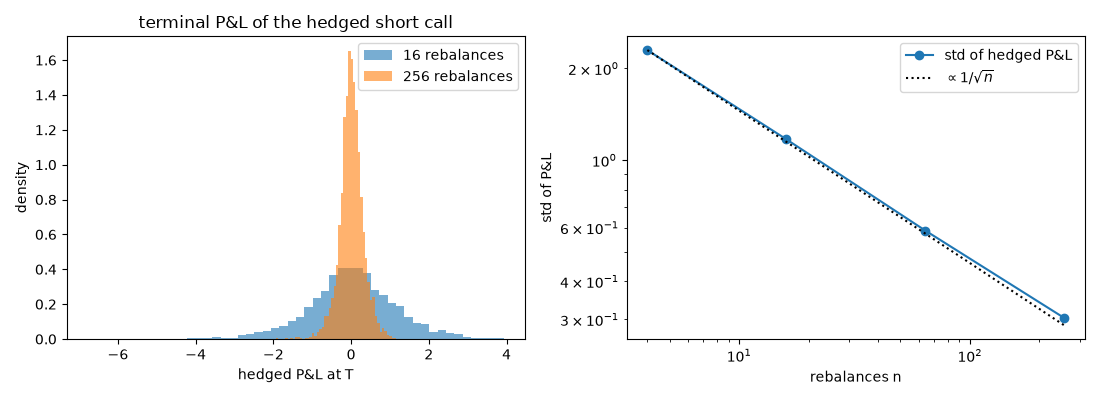
n =   4: mean P&L -0.009, std 2.297  (premium 6.889)
n =  16: mean P&L +0.011, std 1.171  (premium 6.889)
n =  64: mean P&L +0.001, std 0.588  (premium 6.889)
n = 256: mean P&L +0.008, std 0.304  (premium 6.889)
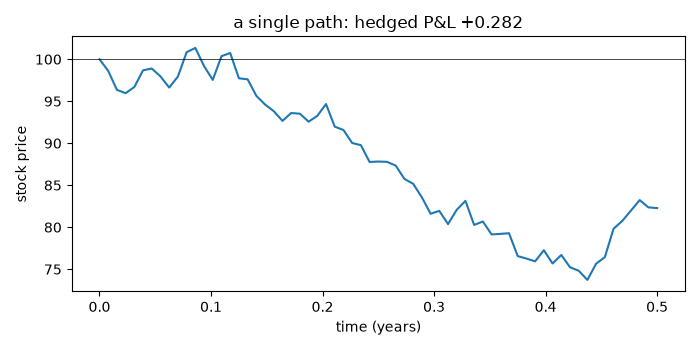
One path: the hedge tracks the option#
res = delta_hedge(S0, K, T, r, sigma, n_rebalance=64, n_paths=1, rng=5)
fig, ax = plt.subplots(figsize=(7, 3.5))
ax.plot(res.times, res.spot[0])
ax.axhline(K, color="k", lw=0.5)
ax.set_xlabel("time (years)")
ax.set_ylabel("stock price")
ax.set_title(f"a single path: hedged P&L {res.pnl[0]:+.3f}")
fig.tight_layout()

plt.show()
Total running time of the script: (0 minutes 0.271 seconds)
