
Note
Go to the end to download the full example code or to run this example in your browser via JupyterLite.
Frobenius’s character tables#
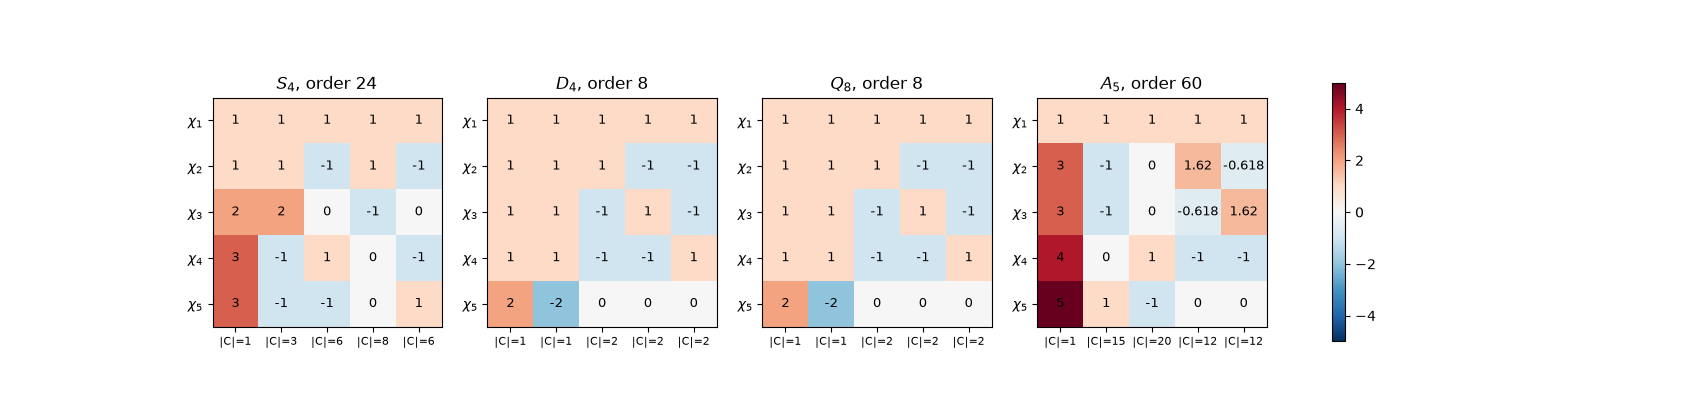
In 1896 Frobenius attached to each finite group a square table of numbers: one row per irreducible character \(\chi(g) = \operatorname{tr}\rho(g)\), one column per conjugacy class. The rows are orthonormal, the squares of the first column sum to \(|G|\), and the table encodes much of the group’s structure in a handful of numbers. Here the tables are computed by Burnside’s algorithm, from the class multiplication constants alone, without constructing any representation.
import matplotlib.pyplot as plt
import numpy as np

from mathematicskit.abstract_algebra import DihedralGroup, PermutationGroup, QuaternionGroup, character_table


def show(name, result):
    print(f"{name}: class sizes {result.class_sizes}, degrees {result.degrees}")
    for row in result.table:
        print("   " + "  ".join(f"{z.real:6.3f}" if abs(z.imag) < 1e-9 else f"{z.real:+.2f}{z.imag:+.2f}i" for z in row))
S_4, the rotations of a cube#
s4 = character_table(PermutationGroup(4))
show("S_4", s4)
sizes = np.array(s4.class_sizes)
gram = (s4.table * sizes) @ s4.table.conj().T / 24
print(f"row orthogonality: max |<chi_i, chi_j> - delta_ij| = {np.abs(gram - np.eye(5)).max():.1e}")
print(f"sum of squared degrees = {sum(d**2 for d in s4.degrees)} = |S_4|")
S_4: class sizes [1, 3, 6, 8, 6], degrees [1, 1, 2, 3, 3]
    1.000   1.000   1.000   1.000   1.000
    1.000   1.000  -1.000   1.000  -1.000
    2.000   2.000   0.000  -1.000   0.000
    3.000  -1.000   1.000   0.000  -1.000
    3.000  -1.000  -1.000   0.000   1.000
row orthogonality: max |<chi_i, chi_j> - delta_ij| = 0.0e+00
sum of squared degrees = 24 = |S_4|
Two groups, one table#
The dihedral group \(D_4\) (symmetries of a square) and the quaternion group \(Q_8\) are not isomorphic: \(D_4\) has five elements of order 2, \(Q_8\) only one. Yet their character tables are identical, a classic warning that the table does not determine the group.
d4, q8 = character_table(DihedralGroup(4)), character_table(QuaternionGroup())
show("D_4", d4)
show("Q_8", q8)
print(f"identical tables: {np.allclose(d4.table, q8.table)}")
for name, group in (("D_4", DihedralGroup(4)), ("Q_8", QuaternionGroup())):
    print(f"elements of order 2 in {name}: {sum(group.element_order(g) == 2 for g in group.elements)}")
D_4: class sizes [1, 1, 2, 2, 2], degrees [1, 1, 1, 1, 2]
    1.000   1.000   1.000   1.000   1.000
    1.000   1.000   1.000  -1.000  -1.000
    1.000   1.000  -1.000   1.000  -1.000
    1.000   1.000  -1.000  -1.000   1.000
    2.000  -2.000   0.000   0.000   0.000
Q_8: class sizes [1, 1, 2, 2, 2], degrees [1, 1, 1, 1, 2]
    1.000   1.000   1.000   1.000   1.000
    1.000   1.000   1.000  -1.000  -1.000
    1.000   1.000  -1.000   1.000  -1.000
    1.000   1.000  -1.000  -1.000   1.000
    2.000  -2.000   0.000   0.000   0.000
identical tables: True
elements of order 2 in D_4: 5
elements of order 2 in Q_8: 1
A_5 and the golden ratio#
The rotation group of the icosahedron is \(A_5\). Its two three-dimensional characters take the values \((1 \pm \sqrt5)/2\) on the two classes of 5-cycles, the golden ratio of the icosahedron’s geometry.
a5_group = PermutationGroup(5, generators=[(1, 2, 0, 3, 4), (0, 1, 3, 4, 2)])
a5 = character_table(a5_group)
show("A_5", a5)
A_5: class sizes [1, 15, 20, 12, 12], degrees [1, 3, 3, 4, 5]
    1.000   1.000   1.000   1.000   1.000
    3.000  -1.000   0.000   1.618  -0.618
    3.000  -1.000   0.000  -0.618   1.618
    4.000   0.000   1.000  -1.000  -1.000
    5.000   1.000  -1.000   0.000   0.000
The tables as images#
fig, axes = plt.subplots(1, 4, figsize=(17, 4.2))
for ax, (name, result) in zip(axes, [("$S_4$", s4), ("$D_4$", d4), ("$Q_8$", q8), ("$A_5$", a5)], strict=True):
    values = result.table.real
    image = ax.imshow(values, cmap="RdBu_r", vmin=-5, vmax=5)
    for (i, j), v in np.ndenumerate(values):
        ax.text(j, i, f"{v:.3g}", ha="center", va="center", fontsize=9)
    ax.set_xticks(range(len(result.classes)), [f"|C|={c}" for c in result.class_sizes], fontsize=8)
    ax.set_yticks(range(len(result.classes)), [rf"$\chi_{i + 1}$" for i in range(len(result.classes))])
    ax.set_title(f"{name}, order {sum(result.class_sizes)}")
fig.colorbar(image, ax=axes, shrink=0.8)

plt.show()
Total running time of the script: (0 minutes 0.746 seconds)
