
Note
Go to the end to download the full example code or to run this example in your browser via JupyterLite.
Adaptive quadrature (QUADPACK): subdividing where it is needed#
QUADPACK’s adaptive strategy estimates each subinterval’s integral two
ways and splits only those subintervals where the estimates disagree.
AdaptiveQuadrature wraps
scipy.integrate.quad() (QUADPACK’s QAGS). Recording every point
at which it samples a sharply peaked integrand shows the evaluations
crowding around the peak, and a fixed equally spaced rule needs far more
evaluations to match its accuracy.
import matplotlib.pyplot as plt
import numpy as np

from mathematicskit.calculus import AdaptiveQuadrature, TrapezoidalRule
Where does the adaptive routine sample?#
def peaked(x):
    return 1.0 / (1.0 + 1000.0 * (x - 0.3) ** 2)


a, b = 0.0, 1.0
s = np.sqrt(1000.0)
exact = (np.arctan(s * (b - 0.3)) - np.arctan(s * (a - 0.3))) / s

samples = []


def recorded(x):
    samples.append(x)
    return peaked(x)


result = AdaptiveQuadrature(tol=1e-10).integrate(recorded, a, b)
print(f"adaptive: value={result.value:.12f}, |error|={abs(result.value - exact):.1e}, evaluations={result.n_evaluations}")

grid = np.linspace(a, b, 1000)
fig, (ax1, ax2) = plt.subplots(2, 1, figsize=(6, 5.5), sharex=True, gridspec_kw={"height_ratios": [2, 1]})
ax1.plot(grid, peaked(grid), "k")
ax1.plot(samples, peaked(np.asarray(samples)), "|", color="C0", ms=10)
ax1.set_title("QUADPACK samples cluster where the integrand varies")
ax2.hist(samples, bins=50, color="C0")
ax2.set_xlabel("x")
ax2.set_ylabel("evaluations")
fig.tight_layout()
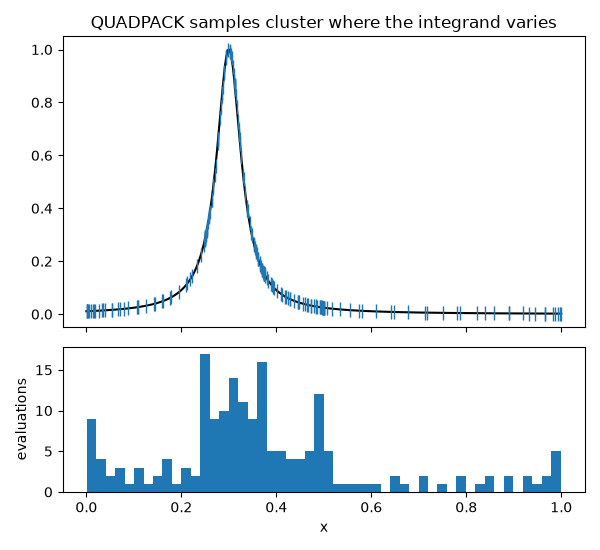
adaptive: value=0.094597212547, |error|=1.8e-16, evaluations=189
Matching the accuracy with a fixed, equally spaced rule#
trapezoidal,    101 evaluations: |error|=6.5e-07
trapezoidal,   1001 evaluations: |error|=6.5e-09
trapezoidal,  10001 evaluations: |error|=6.5e-11
trapezoidal, 100001 evaluations: |error|=6.5e-13
Total running time of the script: (0 minutes 0.070 seconds)
