
Note
Go to the end to download the full example code or to run this example in your browser via JupyterLite.
How long is the coast of Britain? The divider method#
Walks a pair of dividers along a smooth circle and along the Koch curve with ever smaller openings. The circle’s measured length converges, but the Koch curve’s grows as a power of the ruler, the scaling Richardson observed for real coastlines and Mandelbrot interpreted as a fractal dimension.
import matplotlib.pyplot as plt
import numpy as np

from mathematicskit.fractals_chaos import divider_length, koch_curve
Measured length against ruler size#
t = np.linspace(0, 2 * np.pi, 20001)
circle = np.column_stack([np.cos(t), np.sin(t)]) / (2 * np.pi)  # circumference 1
koch = koch_curve(8)
rulers = 3.0 ** -np.arange(1, 7)
circle_lengths = [divider_length(circle, r) for r in rulers]
koch_lengths = [divider_length(koch, r) for r in rulers]

slope = np.polyfit(np.log(rulers), np.log(koch_lengths), 1)[0]
print(f"Koch curve: L ~ ruler^{slope:.4f}, so D = 1 - slope = {1 - slope:.4f} (log 4 / log 3 = {np.log(4) / np.log(3):.4f})")

fig, ax = plt.subplots()
ax.loglog(rulers, circle_lengths, "o-", label="circle (smooth)")
ax.loglog(rulers, koch_lengths, "s-", label="Koch curve (fractal)")
ax.set_xlabel("ruler length")
ax.set_ylabel("measured length")
ax.invert_xaxis()
ax.legend()
ax.set_title("Richardson plot")
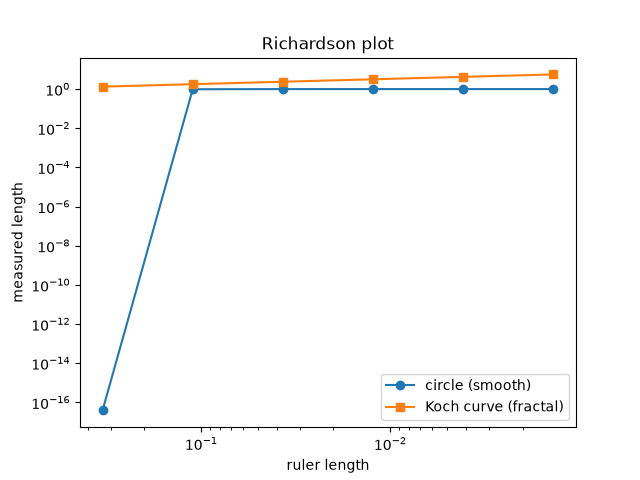
Koch curve: L ~ ruler^-0.2619, so D = 1 - slope = 1.2619 (log 4 / log 3 = 1.2619)

Text(0.5, 1.0, 'Richardson plot')
Total running time of the script: (0 minutes 1.779 seconds)
