
Note
Go to the end to download the full example code or to run this example in your browser via JupyterLite.
Lyapunov exponent across the logistic map’s route to chaos#
Sweeps the logistic map’s growth-rate parameter r and estimates the
Lyapunov exponent at each value: negative in the periodic windows,
crossing zero exactly at each bifurcation, and mostly positive beyond
the onset of chaos at r ~ 3.56995.
import matplotlib.pyplot as plt
import numpy as np

from mathematicskit.fractals_chaos import lyapunov_exponent_1d_map
Sweep r and estimate the exponent at each value#
Plot: exponent crosses zero at each period-doubling bifurcation#
fig, ax = plt.subplots()
ax.plot(r_values, exponents, lw=0.8)
ax.axhline(0.0, color="black", lw=0.6)
ax.set_xlabel("r")
ax.set_ylabel("Lyapunov exponent")
ax.set_title("Logistic map: Lyapunov exponent vs. growth rate")
print("fraction of chaotic (positive-exponent) r values sampled:", float(np.mean(exponents > 0)))
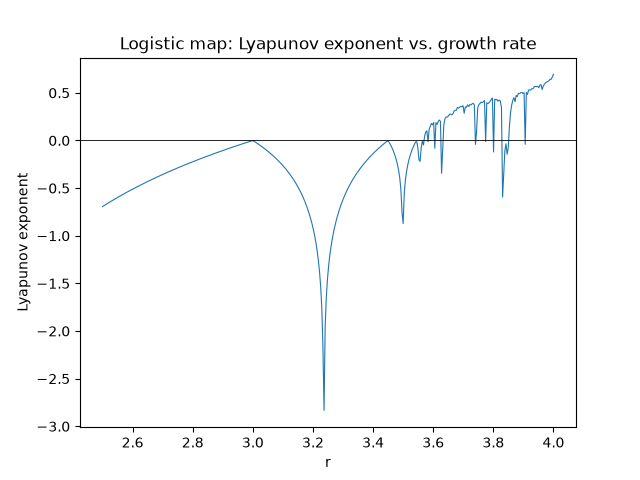
fraction of chaotic (positive-exponent) r values sampled: 0.2525
Total running time of the script: (0 minutes 0.234 seconds)
