
Note
Go to the end to download the full example code or to run this example in your browser via JupyterLite.
The Mandelbrot set#
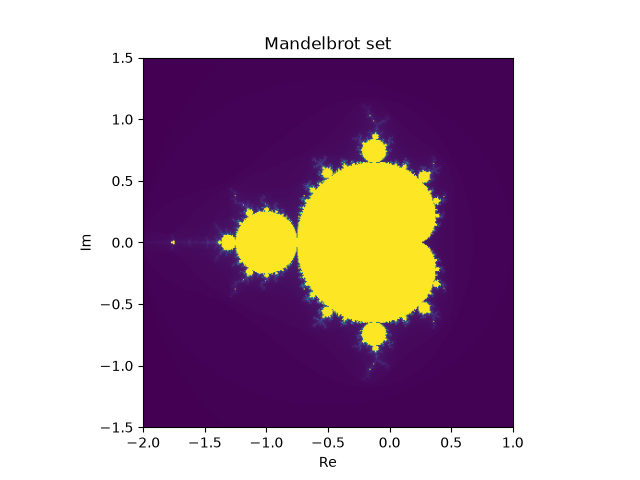
Colours every parameter \(c\) by how quickly the orbit of \(z_0 = 0\) under \(z \mapsto z^2 + c\) escapes. The black region, the Mandelbrot set, is the set of \(c\) whose orbit stays bounded – equivalently, whose Julia set is connected. Zooming into its boundary reveals ever finer detail, including small copies of the whole set.
import matplotlib.pyplot as plt

from mathematicskit.fractals_chaos import mandelbrot_set
from mathematicskit.fractals_chaos.visualizers.plots import plot_escape_time
The whole set#
mandelbrot = mandelbrot_set(resolution=400, max_iter=200)
ax = plot_escape_time(mandelbrot)
ax.set_title("Mandelbrot set")
Text(0.5, 1.0, 'Mandelbrot set')
Zooming into the boundary#
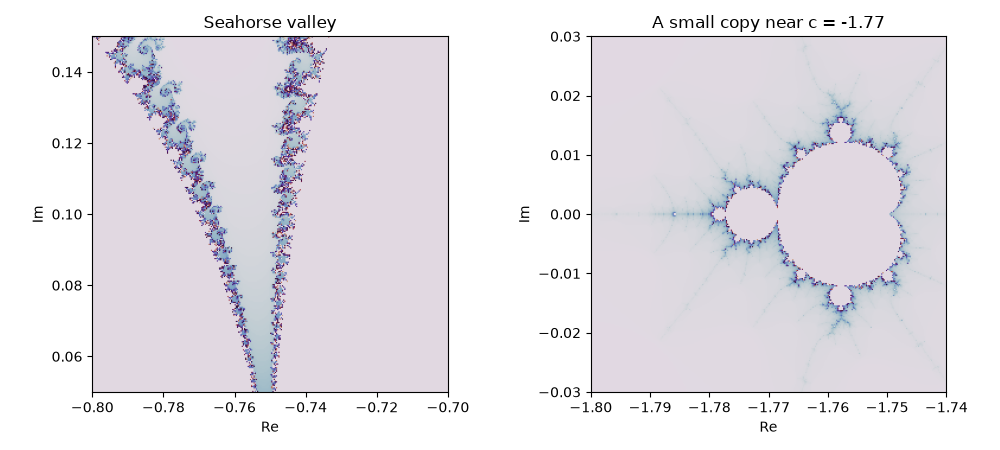
Near \(c \approx -1.77\) on the real axis, a small copy of the Mandelbrot set sits inside the boundary’s filaments.
fig, axes = plt.subplots(1, 2, figsize=(10, 4.5))
seahorse = mandelbrot_set(extent=(-0.80, -0.70, 0.05, 0.15), resolution=300, max_iter=400)
plot_escape_time(seahorse, ax=axes[0], cmap="twilight")
axes[0].set_title("Seahorse valley")
minibrot = mandelbrot_set(extent=(-1.80, -1.74, -0.03, 0.03), resolution=300, max_iter=400)
plot_escape_time(minibrot, ax=axes[1], cmap="twilight")
axes[1].set_title("A small copy near c = -1.77")
fig.tight_layout()
Membership check#
\(c=-1\) and \(c=0.25\) lie in the set (bounded orbits); \(c = 0.3\) and \(c = 1\) do not.
c = -1.00: bounded (in the set)
c =  0.25: bounded (in the set)
c =  0.30: escapes after 12 steps
c =  1.00: escapes after 3 steps
Total running time of the script: (0 minutes 0.223 seconds)
