
Note
Go to the end to download the full example code or to run this example in your browser via JupyterLite.
Fiedler’s spectral bipartition of a “barbell” graph#
Two dense clusters joined by a single bridge edge – a case where the Fiedler vector’s sign cleanly recovers the two clusters, and the small algebraic connectivity reflects how easily the graph is disconnected (by removing just the bridge).
from mathematicskit.graph_theory import Graph, spectral_analysis
from mathematicskit.graph_theory.utils.generators import complete_graph
from mathematicskit.graph_theory.visualizers.plots import plot_spectral_bipartition
Build the barbell graph: two K5 cliques joined by one edge#
cluster_size = 5
g = Graph(2 * cluster_size)
left = complete_graph(cluster_size)
right = complete_graph(cluster_size)
for u, v, w in left.edges():
    g.add_edge(u, v, w)
for u, v, w in right.edges():
    g.add_edge(u + cluster_size, v + cluster_size, w)
g.add_edge(cluster_size - 1, cluster_size)  # the single bridge
Spectral analysis#
result = spectral_analysis(g)
print(f"algebraic connectivity: {result.algebraic_connectivity:.4f}")
print(f"spectral bipartition: {result.bipartition.astype(int)}")

plot_spectral_bipartition(g, result)
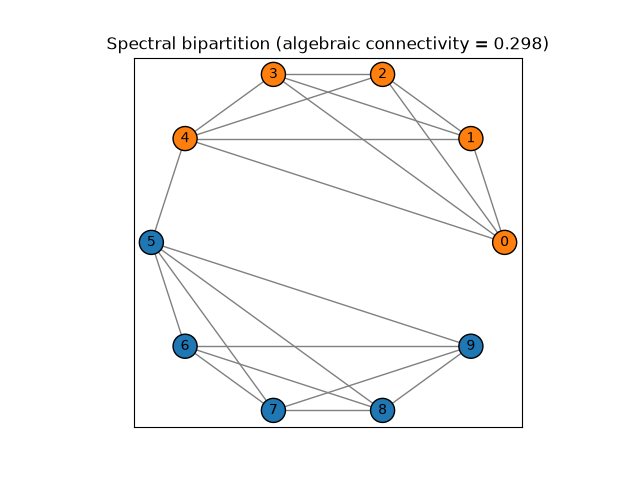
algebraic connectivity: 0.2984
spectral bipartition: [1 1 1 1 1 0 0 0 0 0]

<Axes: title={'center': 'Spectral bipartition (algebraic connectivity = 0.298)'}>
Total running time of the script: (0 minutes 0.018 seconds)
