
Note
Go to the end to download the full example code or to run this example in your browser via JupyterLite.
Hartley’s measure of information (1928)#
Hartley measured the information in a message of \(L\) symbols from an alphabet of \(n\) as \(L\log n\): the logarithm makes information add up when messages are concatenated. The plot compares alphabets by the bits each symbol carries, and the number of symbols needed to send one of a million equally likely messages.
import matplotlib.pyplot as plt
import numpy as np

from mathematicskit.information_theory import hartley_information

alphabets = {"binary": 2, "decimal": 10, "Latin letters": 26, "bytes": 256}
for name, n in alphabets.items():
    print(f"{name:>14}: {hartley_information(n):6.3f} bits/symbol, {hartley_information(n, base=10):.3f} hartleys/symbol")
       binary:  1.000 bits/symbol, 0.301 hartleys/symbol
      decimal:  3.322 bits/symbol, 1.000 hartleys/symbol
Latin letters:  4.700 bits/symbol, 1.415 hartleys/symbol
        bytes:  8.000 bits/symbol, 2.408 hartleys/symbol
Additivity: \(L\) symbols carry \(L\) times the information#
lengths = np.arange(1, 21)
fig, (ax1, ax2) = plt.subplots(1, 2, figsize=(11, 4))
for name, n in alphabets.items():
    ax1.plot(lengths, [hartley_information(n, length=L) for L in lengths], "o-", ms=3, label=name)
ax1.axhline(np.log2(1e6), color="k", ls="--", lw=1, label="one of $10^6$ messages")
ax1.set_xlabel("message length L")
ax1.set_ylabel("information (bits)")
ax1.legend()

n = np.arange(2, 257)
ax2.plot(n, np.ceil(np.log2(1e6) / hartley_information(n)), drawstyle="steps-mid")
ax2.set_xscale("log", base=2)
ax2.set_xlabel("alphabet size n")
ax2.set_ylabel("symbols needed for $10^6$ messages")
fig.suptitle(r"Hartley (1928): $H_0 = L \log_2 n$")
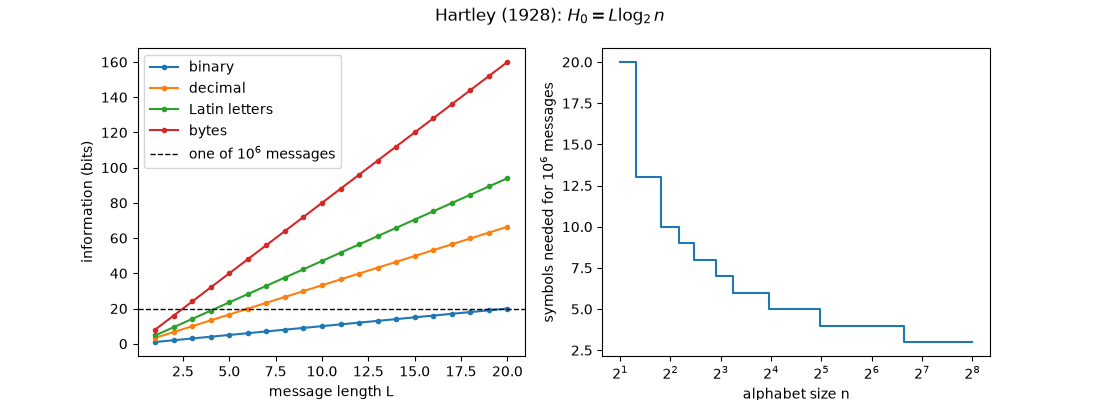
Text(0.5, 0.98, 'Hartley (1928): $H_0 = L \\log_2 n$')
Total running time of the script: (0 minutes 0.060 seconds)
