
Note
Go to the end to download the full example code or to run this example in your browser via JupyterLite.
Elimination in the Nine Chapters: the three grades of grain#
The first problem of Chapter 8 (Fangcheng, “rectangular arrays”) of the Nine Chapters on the Mathematical Art: 3 bundles of top-grade, 2 of medium-grade and 1 of low-grade grain yield 39 dou; 2, 3 and 1 bundles yield 34; 1, 2 and 3 bundles yield 26. How much does one bundle of each grade yield?
The text lays the coefficients out on a counting board and eliminates unknowns without ever dividing: to clear an entry it multiplies a whole row by the pivot and subtracts a multiple of the pivot row. This script replays that division-free elimination step by step and checks the answer against a modern pivoted LU solve.
import matplotlib.pyplot as plt
import numpy as np

from mathematicskit.linalg import lu_solve_system
from mathematicskit.linalg.visualizers.plots import plot_matrix_heatmap
The counting board#
One row per bundle mix: [top, medium, low | yield].
initial board:
 [[ 3  2  1 39]
 [ 2  3  1 34]
 [ 1  2  3 26]]
Division-free elimination, column by column#
To clear board[j, i] the row j is replaced by
pivot * row_j - board[j, i] * row_i – integers stay integers.
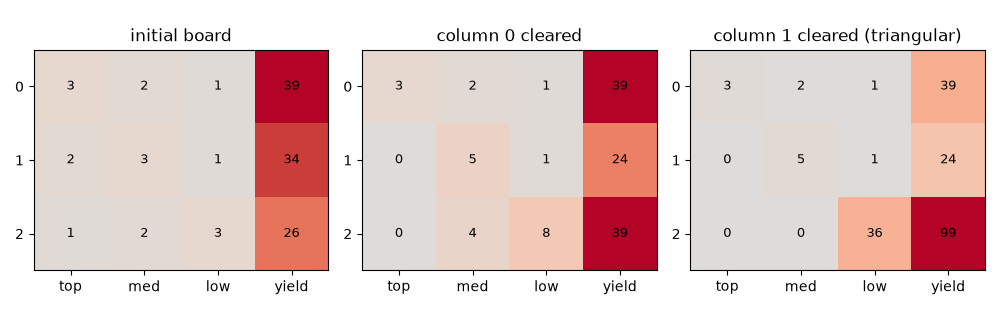
after clearing column 0:
 [[ 3  2  1 39]
 [ 0  5  1 24]
 [ 0  4  8 39]]
after clearing column 1:
 [[ 3  2  1 39]
 [ 0  5  1 24]
 [ 0  0 36 99]]
Back substitution#
x = np.zeros(3)
for i in (2, 1, 0):
    x[i] = (board[i, 3] - board[i, i + 1 : 3] @ x[i + 1 :]) / board[i, i]
print("yield per bundle (top, medium, low):", x, "dou")
print("Nine Chapters answer: 9 1/4, 4 1/4, 2 3/4 dou")

A = stages[0][:, :3]
b = stages[0][:, 3]
print("agrees with pivoted LU solve:", np.allclose(x, lu_solve_system(A, b)))
yield per bundle (top, medium, low): [9.25 4.25 2.75] dou
Nine Chapters answer: 9 1/4, 4 1/4, 2 3/4 dou
agrees with pivoted LU solve: True
The board becomes triangular#
fig, axes = plt.subplots(1, 3, figsize=(10, 3.2))
titles = ["initial board", "column 0 cleared", "column 1 cleared (triangular)"]
for ax, stage, title in zip(axes, stages, titles, strict=False):
    plot_matrix_heatmap(stage, ax=ax, title=title)
    for (r, c), val in np.ndenumerate(stage):
        ax.text(c, r, f"{val:.0f}", ha="center", va="center", fontsize=9)
    ax.set_xticks(range(4), ["top", "med", "low", "yield"])
    ax.set_yticks(range(3))
fig.tight_layout()

plt.show()
Total running time of the script: (0 minutes 0.059 seconds)
