
Note
Go to the end to download the full example code or to run this example in your browser via JupyterLite.
Euler’s totient function and Euler’s theorem#
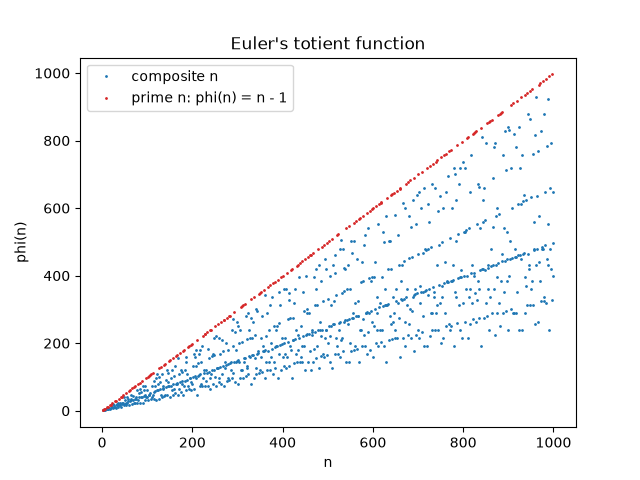
Euler’s \(\varphi(n)\) counts the integers in \(1, \dots, n\) coprime to \(n\). His 1763 theorem, \(a^{\varphi(n)} \equiv 1 \pmod n\) for \(\gcd(a, n) = 1\), generalizes Fermat’s little theorem (\(\varphi(p) = p - 1\) for a prime \(p\)). This script checks the definition and the theorem and plots \(\varphi(n)\), whose top edge \(n - 1\) is traced by the primes.
import math

import matplotlib.pyplot as plt
import numpy as np

from mathematicskit.number_theory import euler_totient, fast_mod_pow, is_prime_trial_division
phi(n) counts the coprime residues#
phi(9) =  6  (count of coprime k <= n: 6)
phi(10) =  4  (count of coprime k <= n: 4)
phi(12) =  4  (count of coprime k <= n: 4)
phi(36) = 12  (count of coprime k <= n: 12)
phi(97) = 96  (count of coprime k <= n: 96)
Euler’s theorem: a^phi(n) = 1 (mod n)#
holds = all(fast_mod_pow(a, euler_totient(n), n) == 1 for n in range(2, 300) for a in range(1, n) if math.gcd(a, n) == 1)
print("Euler's theorem holds for every n < 300 and every coprime a:", holds)
print(f"e.g. 7^phi(40) = 7^{euler_totient(40)} = {fast_mod_pow(7, euler_totient(40), 40)} (mod 40)")
Euler's theorem holds for every n < 300 and every coprime a: True
e.g. 7^phi(40) = 7^16 = 1 (mod 40)
The totient function up to 1000#
ns = np.arange(1, 1001)
phis = np.array([euler_totient(int(n)) for n in ns])
is_p = np.array([is_prime_trial_division(int(n)) for n in ns])

fig, ax = plt.subplots()
ax.plot(ns[~is_p], phis[~is_p], ".", ms=2, color="tab:blue", label="composite n")
ax.plot(ns[is_p], phis[is_p], ".", ms=2, color="tab:red", label="prime n: phi(n) = n - 1")
ax.set_xlabel("n")
ax.set_ylabel("phi(n)")
ax.set_title("Euler's totient function")
ax.legend()
plt.show()
Total running time of the script: (0 minutes 0.048 seconds)
