
Note
Go to the end to download the full example code or to run this example in your browser via JupyterLite.
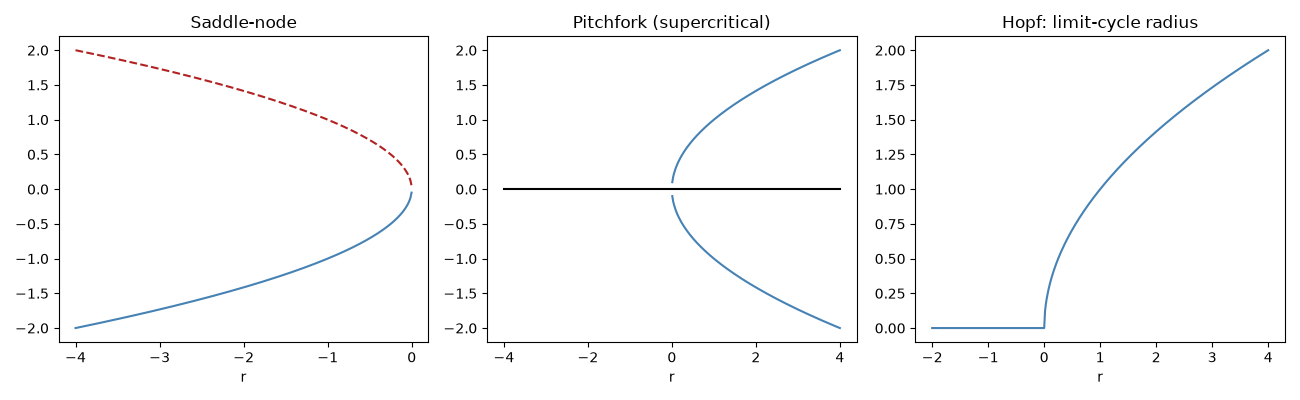
Saddle-node, pitchfork, and Hopf bifurcation diagrams#
Plots the closed-form fixed points (or limit-cycle radius) of the three
canonical bifurcation normal forms as a function of the control
parameter r, showing the characteristic collision-and-annihilation,
splitting, and birth-of-a-limit-cycle shapes.
import matplotlib.pyplot as plt
import numpy as np

from mathematicskit.ode_dynamics.systems.bifurcations import hopf_limit_cycle_radius, pitchfork_fixed_points, saddle_node_fixed_points
Saddle-node: two fixed points collide and annihilate#
r_sn = np.linspace(-4.0, 1.0, 400)
fp_sn = saddle_node_fixed_points(r_sn)
Pitchfork: one branch splits into three#
r_pf = np.linspace(-4.0, 4.0, 400)
fp_pf = pitchfork_fixed_points(r_pf, kind="supercritical")
Hopf: a limit cycle is born and grows#
r_hopf = np.linspace(-2.0, 4.0, 400)
radius_hopf = hopf_limit_cycle_radius(r_hopf)

fig, axes = plt.subplots(1, 3, figsize=(13, 4))
axes[0].plot(r_sn, fp_sn[:, 0], color="steelblue")
axes[0].plot(r_sn, fp_sn[:, 1], color="firebrick", linestyle="--")
axes[0].set_title("Saddle-node")
axes[0].set_xlabel("r")

axes[1].plot(r_pf, fp_pf[:, 0], color="black")
axes[1].plot(r_pf, fp_pf[:, 1], color="steelblue")
axes[1].plot(r_pf, fp_pf[:, 2], color="steelblue")
axes[1].set_title("Pitchfork (supercritical)")
axes[1].set_xlabel("r")

axes[2].plot(r_hopf, radius_hopf, color="steelblue")
axes[2].set_title("Hopf: limit-cycle radius")
axes[2].set_xlabel("r")
fig.tight_layout()

plt.show()
Total running time of the script: (0 minutes 0.081 seconds)
