
Note
Go to the end to download the full example code or to run this example in your browser via JupyterLite.
The Kermack-McKendrick SIR model#
An epidemic grows only if \(R_0 S_0 > 1\), peaks when the susceptible fraction falls to \(1/R_0\), and burns out before infecting everyone. The simulated peak and final size agree with the closed-form Kermack-McKendrick relations.
import matplotlib.pyplot as plt

from mathematicskit.ode_dynamics.systems.epidemics import SIRModel, sir_final_size, sir_peak_infected

s0, i0 = 0.999, 0.001
Epidemic curves for several reproduction numbers#
fig, ax = plt.subplots(figsize=(7, 4.5))
for beta in (0.15, 0.3, 0.5):
    system = SIRModel([s0, i0, 0.0], beta=beta, gamma=0.1)
    traj = system.integrate((0.0, 300.0), dt=0.05, method="rk4")
    ax.plot(traj.t, traj.y[:, 1], label=f"R0={system.r0:.1f}")
    print(
        f"R0={system.r0:.1f}: peak I {traj.y[:, 1].max():.4f} (theory {sir_peak_infected(system.r0, s0, i0):.4f}), "
        f"final S {traj.y[-1, 0]:.4f} (theory {sir_final_size(system.r0, s0, i0):.4f})"
    )
ax.set_xlabel("t")
ax.set_ylabel("infected fraction I(t)")
ax.set_title("SIR epidemics: larger R0, earlier and higher peak")
ax.legend()
fig.tight_layout()

plt.show()
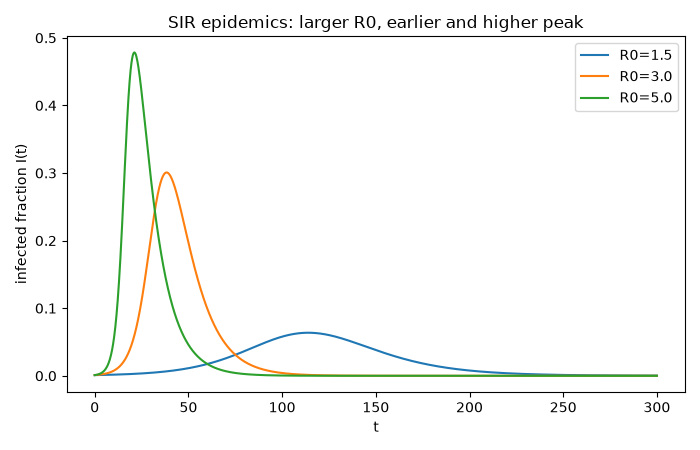
R0=1.5: peak I 0.0637 (theory 0.0637), final S 0.4164 (theory 0.4161)
R0=3.0: peak I 0.3008 (theory 0.3008), final S 0.0594 (theory 0.0594)
R0=5.0: peak I 0.4783 (theory 0.4783), final S 0.0070 (theory 0.0070)
Total running time of the script: (0 minutes 0.776 seconds)
