
Note
Go to the end to download the full example code or to run this example in your browser via JupyterLite.
Rosenbrock’s banana function: a narrow curved valley#
\(f(x, y) = 100(y-x^2)^2 + (1-x)^2\) has its minimum \(f=0\) at \((1, 1)\), at the end of a banana-shaped valley along the parabola \(y = x^2\). The walls are steep, but the floor is almost flat, so a method without curvature information finds the valley quickly and then crawls along it.
import matplotlib.pyplot as plt
import numpy as np

from mathematicskit.optimization import GradientDescentLineSearch, rosenbrock, rosenbrock_grad, rosenbrock_hess
Ill-conditioning at the minimum#
The Hessian at \((1, 1)\) has eigenvalues about 2500 times apart: the curvature across the valley dwarfs the curvature along it.
eigs = np.linalg.eigvalsh(rosenbrock_hess(np.array([1.0, 1.0])))
print(f"Hessian eigenvalues at (1, 1): {eigs.round(3)}, condition number {eigs[-1] / eigs[0]:.0f}")
t = 0.0
print(f"on the floor f({t}, {t**2}) = {rosenbrock(np.array([t, t**2])):.1f}; 0.5 above it f({t}, {t**2 + 0.5}) = {rosenbrock(np.array([t, t**2 + 0.5])):.1f}")
Hessian eigenvalues at (1, 1): [3.990000e-01 1.001601e+03], condition number 2508
on the floor f(0.0, 0.0) = 1.0; 0.5 above it f(0.0, 0.5) = 26.0
Gradient descent crawls along the valley floor#
x0 = np.array([-1.2, 1.0])
gd = GradientDescentLineSearch(tol=1e-6, max_iter=5000).minimize(rosenbrock, rosenbrock_grad, x0)
print(f"gradient descent from {x0}: {gd.iterations} iterations, converged = {gd.converged}, x = {gd.x.round(4)}")

xs = np.linspace(-2.0, 2.0, 300)
ys = np.linspace(-1.0, 3.0, 300)
X, Y = np.meshgrid(xs, ys)
Z = 100.0 * (Y - X**2) ** 2 + (1.0 - X) ** 2

fig, (ax1, ax2) = plt.subplots(1, 2, figsize=(11, 4.5))
cs = ax1.contourf(X, Y, np.log10(1.0 + Z), levels=30, cmap="viridis")
fig.colorbar(cs, ax=ax1, label=r"$\log_{10}(1 + f)$")
ax1.plot(xs, xs**2, "w--", lw=1, label=r"valley floor $y = x^2$")
ax1.plot(*gd.path.T, ".-", color="tab:orange", ms=2, lw=0.8, label="gradient descent")
ax1.plot(1.0, 1.0, "r*", ms=14, label="minimum (1, 1)")
ax1.set_ylim(-1.0, 3.0)
ax1.set_xlabel("x")
ax1.set_ylabel("y")
ax1.legend(loc="lower right", fontsize=8)
ax1.set_title("Rosenbrock's banana function (1960)")

gap = np.array([rosenbrock(x) for x in gd.path])
ax2.semilogy(gap)
ax2.set_xlabel("iteration")
ax2.set_ylabel(r"$f(x_k)$")
ax2.set_title("Fast descent into the valley, then a slow crawl")
fig.tight_layout()
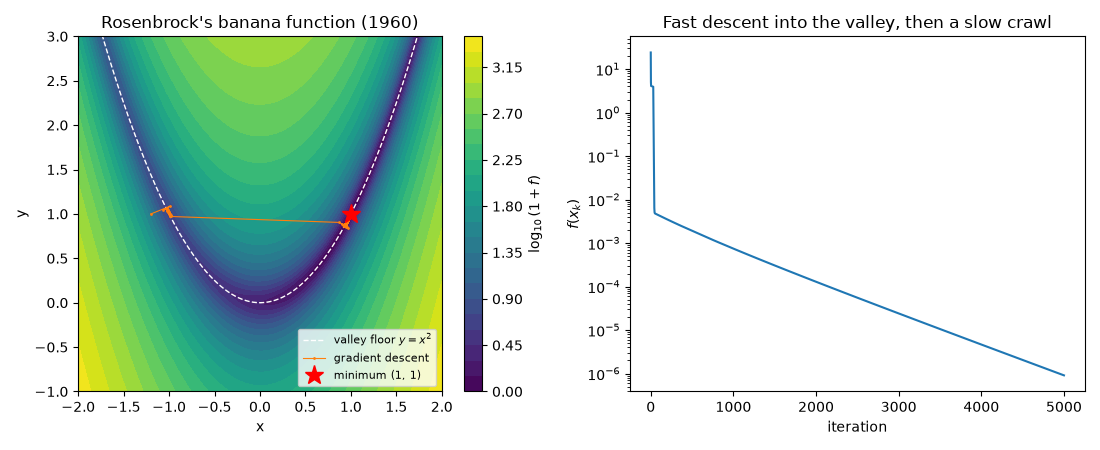
gradient descent from [-1.2 1. ]: 5000 iterations, converged = False, x = [0.999 0.9981]
Total running time of the script: (0 minutes 0.365 seconds)
